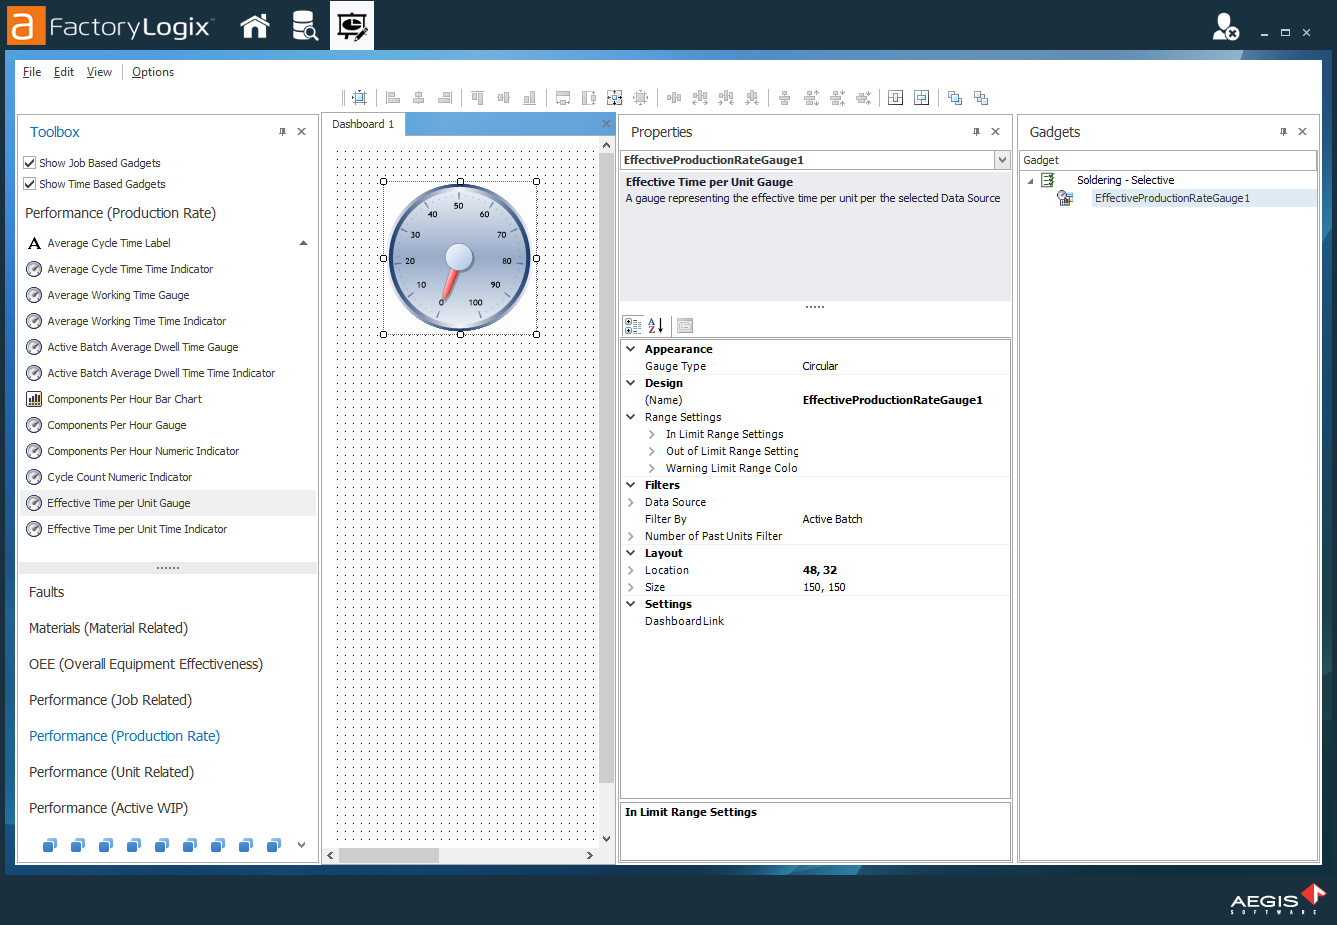
When you create a dashboard in iMonitor Designer, you drag and drop gadgets from the Toolbox onto the work area. Each gadget has specific functionality. Except for the Miscellaneous category, gadgets are either job-based or time-based. You can add gauges, numeric indicators, charts, data grids, progress bars, and dynamic label gadgets to your dashboards, then further customize the dashboard and gadget properties to suit your factory and processes.
Tip
To set the data source for multiple gadgets simultaneously, Ctrl+click each gadget on the right side of the window, then right-click one of the selected gadgets and select Set Data Source on Selected Gadgets. (If the data source was previously undefined, you can select the yellow exclamation mark to set the data source.)
Data sources for gadgets
The data source you select is the item that "feeds" information to a selected dashboard gadget. A data source might be a SMT pick-and-place machine in electronics manufacturing; other data sources might be a selected batch, workstation, operation template, group operation template, or operation alias.
Category
Description
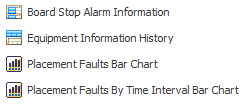
Faults
(Data is shown for the active operation)
Board Stop Alarm Information - Displays a data grid showing board stop alarm information for the selected data source.
Equipment Information History - Displays informational messages such as status, errors, and warnings from the selected data source.
Placement Faults Bar Chart - Displays a bar chart that shows counts for placement faults (components not placed, not recognized, and mis-picks).
Placement Faults By Time Interval Bar Chart - Displays a bar chart that shows counts for placement faults (components not placed, not recognized, and mis-picks) by time interval.
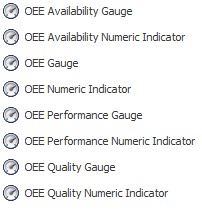
OEE (Overall Equipment Effectiveness)
(Data is shown for the active operation)
OEE Availability Gauge - Displays the OEE availability percentage for the selected data source and time span using a round gauge.
OEE Availability Gauge Numeric Indicator - Displays the OEE availability percentage for the selected data source and time span using a numeric indicator.
OEE Gauge - Displays the OEE percentage for the selected data source and time span using a round gauge.
OEE Numeric Indicator - Displays the OEE percentage for the selected data source and time span using a numeric indicator.
OEE Performance Gauge - Displays the OEE performance percentage for the selected data source and time span using a round gauge.
OEE Performance Numeric Indicator - Displays the OEE performance percentage for the selected data source and time span using a numeric indicator.
OEE Quality Gauge - Displays the OEE quality percentage for the selected data source and time span using a round gauge.
OEE Quality Numeric Indicator - Displays the OEE quality percentage for the selected data source and time span using a numeric indicator.
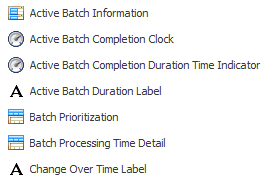
Performance (Job Related)
Active Batch Information - Displays a data grid showing information for the active batch per location: batch, quantity, serial number, customer, assembly, process, process revision, assembly revision, and assembly description.
Active Batch Completion Clock - Displays an analog clock showing the projected completion time for the active job for the selected data source.
Active Batch Completion Duration Time Indicator - Displays continuous countdown time to the projected completion time for the active job for the selected data source.
Active Batch Duration Label - Active Batch Duration Label - Displays the duration for the active batch (uses the active operation to select the active batch).
Batch Prioritization - Displays a data grid showing the batch schedule using the selected product filter (by factory area, for example).
Batch Processing Time Detail - Displays a data grid showing the processing time against the Total Estimated Time allocated per serial number.
Change Over Time Label - Displays the change over time (uses the active operation).
Performance (Production Rate)
(Data is shown for the active operation)
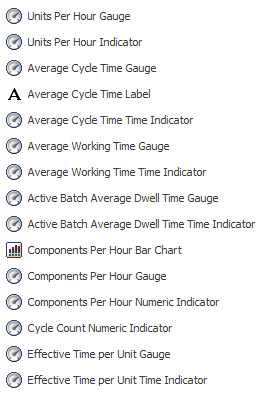
Units Per Hour Gauge - Displays the units per hour for the selected data source using a round gauge.
Units Per Hour Indicator - Displays the units per hour for the selected data source using a numeric indicator.
Average Cycle Time Gauge - Displays the average cycle time for the selected data source using a round gauge.
Average Cycle Time Label - Displays the average cycle time for the active operation.
Average Cycle Time Indicator - Displays the average cycle time for the selected data source using a numeric indicator.
Average Working Time Gauge - Displays the average working time for the selected data source using a round gauge.
Average Working Time Time Indicator - Displays the average cycle time for the selected data source using a numeric indicator.
Active Batch Average Dwell Time Gauge - Displays the average dwell time in the active batch for the selected data source using a round gauge.
Active Batch Average Dwell Time Time Indicator - Displays the average dwell time in the active batch for the selected data source using a numeric indicator.
Components Per Hour Bar Chart - Displays a bar chart showing the components per hour for each operation for the selected data source.
Components Per Hour Gauge - Displays the components per hour for the selected data source using a round gauge.
Components Per Hour Numeric Indicator - Displays the components per hour for the selected data source using a numeric indicator.
Cycle Count Numeric Indicator - Displays the cycle count for the selected data source using a numeric indicator.
Effective Time Per Unit Gauge - Displays the effective time per unit using a round gauge.
Effective Time Per Unit Time Indicator - Displays the effective time per unit using a numeric indicator.
Performance (Unit Related)
(Data is shown for the active operation)
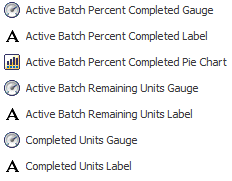
Active Batch Percent Completed Gauge - Displays the percentage completed in the active batch for the selected data source using a progress bar.
Active Batch Percent Completed Label - Displays the percentage completed in the active batch for the selected data source using a text label.
Active Batch Percent Completed Pie Chart - Displays the percentage completed and the percentage remaining in the active batch for the selected data source using a pie chart.
Active Batch Remaining Units Gauge - Displays the remaining number of units to be built in the active batch for the selected data source using a bar gauge.
Active Batch Remaining Units Label - Displays the remaining number of units to be built in the active batch for the selected data source using a text label.
Completed Units Gauge - Displays the completed units for the selected data source using a bar gauge.
Completed Units Label - Displays the completed units for the selected data source using a text label.
Performance (Active WIP)
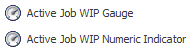
Active Job WIP Gauge - Displays inbound or outbound unit counts in the active batch or time span for the selected data source using a bar gauge.
Active Job WIP Numeric Indicator - Displays inbound or outbound unit counts in the active batch or time span for the selected data source using a numeric indicator.
Performance (Machine Related)
(Data is shown for the active operation)
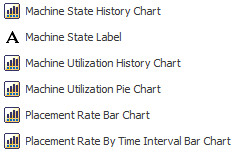
Machine State History Chart - Displays a line chart showing the current and previous machine state for the selected data source and the given time span.
Machine State Label - Displays a machine's current state using text and color.
Machine Utilization History Chart - Displays an area chart showing current and previous machine utilization for the selected data source and time interval.
Machine Utilization Pie Chart - Displays a pie chart showing a machine's current utilization for the selected data source.
Placement Rate Bar Chart - Displays a bar chart representing placement rates for the selected data source.
Placement Rate By Time Interval Bar Chart - Displays a bar chart representing placement rates for the selected data source in intervals of time.
Quality (Defect Related)
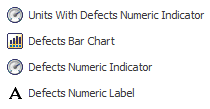
Units With Defects Numeric Indicator - Displays the number of units with defects overall using a numeric indicator.
Defects Bar Chart - Displays a bar chart showing the defect counts for each defect code by active batch or time span for the selected data source.
Defects Numeric Indicator - Displays the number of defects overall using a numeric indicator.
Defects Numeric Label - Displays the number of quality-related defects (uses the active operation).
Quality (Defect Per Million Opportunities) DPMO
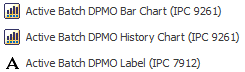
Active Batch DPMO Bar Chart (IPC 9261) - Displays a bar chart representing Defects Per Million Opportunities in the active batch for the selected data source using the IPC 9261 standard).
Active Batch DPMO History Chart (IPC 9261) - Displays a line chart showing the current and previous Defects Per Million Opportunities in the active batch for the selected data source and the given time span using the IPC 9261 standard).
Active Batch DPMO Label (IPC 9261) - Displays the Defects Per Million Opportunities in the active batch using a label.
Quality (Defects Per Unit) DPU
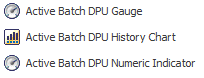
Active Batch DPU Gauge - Displays the number of defects per unit in the active batch for the selected data source using a round gauge.
Active Batch DPU History Chart - Displays a line chart showing the number of defects per unit in the active batch for the selected data source.
Active Batch DPU Numeric Indicator - Displays the number of defects per unit in the active batch for the selected data source using a label.
Quality (Yield)
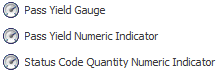
Pass Yield Gauge - Displays the first or second pass yield in the active batch for the selected data source using a round gauge.
Pass Yield Numeric Indicator - Displays the first or second pass yield in the active batch for the selected data source using a numeric indicator.
Status Code Quantity Numeric Indicator - Displays the quantity (numeric) of the status code selected within the selected active batch.
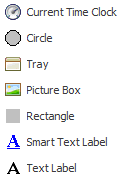
Miscellaneous
Use these tools to customize the layout of a dashboard.
Current Time Clock - Displays an analog clock showing the current local time.
Circle - Creates a circle.
Tray - Creates a dashboard panel.
Picture Box - Creates a box frame for an image.
Rectangle - Creates a rectangle.
Smart Text Label - Creates a Smart Text label that you can link to other components in the dashboard layout.
Text Label - Creates a plain text label.
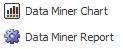
Operational
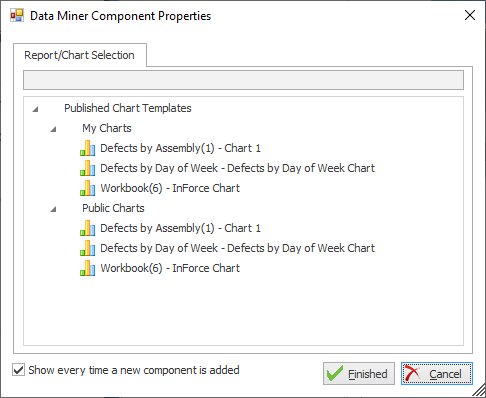
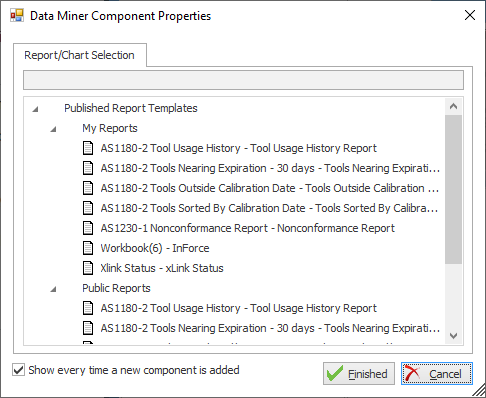
Data Miner Chart - Displays a dialog where you can select a DataMiner chart template or chart to add to a dashboard.
Data Miner Report - Displays a dialog where you can select a DataMiner report template or report to add to a dashboard.
Logistics
(Data is shown for the active operation)
Active Transport Orders - Displays a data grid showing the active transport orders for the selected location filter.
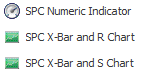
SPC (Statistical Process Control)
(Data is shown for the active operation)
Statistical Process Control (SPC) is a standard methodology to control and measure quality during manufacturing. SPC obtains quality data in the form of product or process measurements in real-time during manufacturing processes.
SPC Numeric Indicator -
SPC X-Bar and R Chart - Displays an X-bar and R (Range) chart consisting of two control charts used with processes that have a subgroup size of two or more. The X-Bar chart shows how the mean or average changes over time; the R chart shows how the subgroups' range changes over time. X-bar and R charts are the standard chart for variables data to help determine if a process is both stable and predictable.
SPC X-Bar and S Chart - Displays an X-bar and S (Sigma) chart consisting of two control charts used with processes that have a subgroup size of 11 or more. This chart uses subgroup standard deviation (instead of a subgroup range) to chart variability. Used with processes, the X-Bar and S chart shows if a system is stable and predictable. Because standard deviation uses each individual reading to calculate variability, the X-Bar and S chart provides a more effective measurement of the process spread than the X-Bar and R chart.
JavaScript errors detected
Please note, these errors can depend on your browser setup.
If this problem persists, please contact our support.