Data page
Use the options on the Data page to do the following:
Provide data for a chart
Bind a chart or individual series to a data source
Customize an argument and a value scale type
Customize the view type of auto-generated series
Apply data filtering and sorting
Adjust the Pivot Chart settings
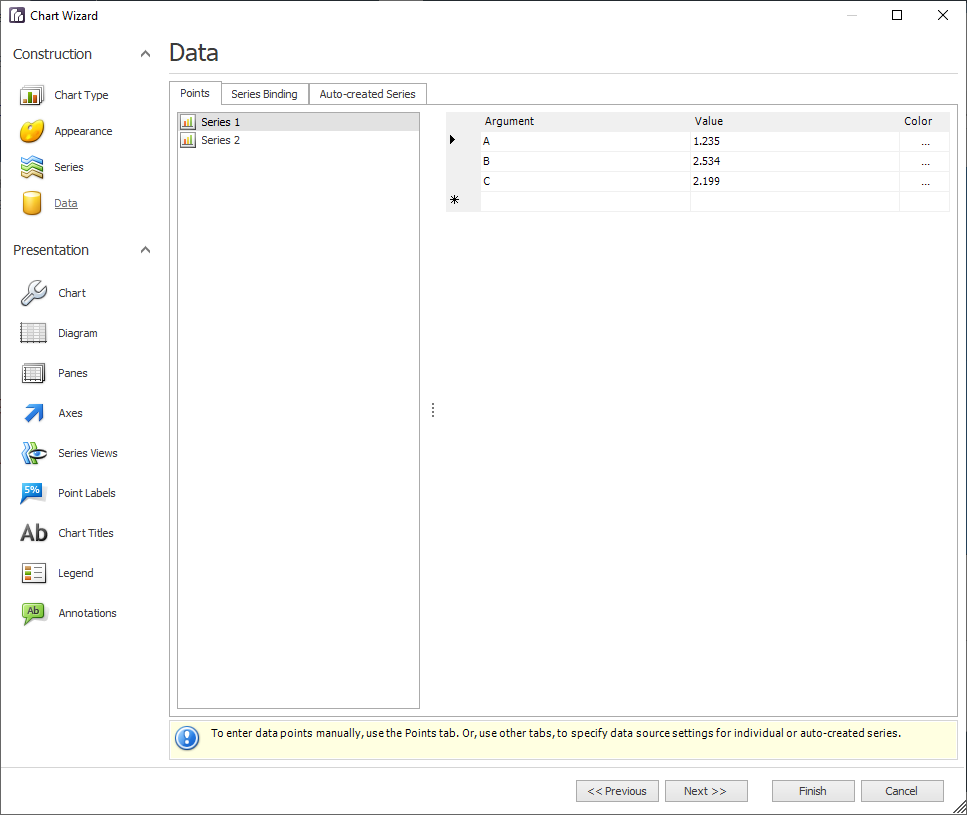
You can provide data for a chart using the tabs described in the following table.
Tab | Description |
|---|---|
Points | Use the Points tab to enter data points for series manually. 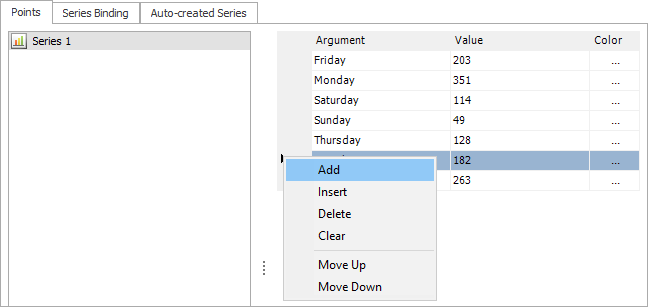 |
Series Binding | Use the Series Binding tab to provide specific data binding options for each series. Note Note that valid Argument and Value entries must correspond to the Argument scale type and the Value scale type selected for the appropriate series on the Series page. Otherwise, an error message will be invoked. |
Auto-created Series | Use the Auto-created Series tab to specify data columns used to generate series, as well as the series view type and other options such as sorting, filtering, and a name template. 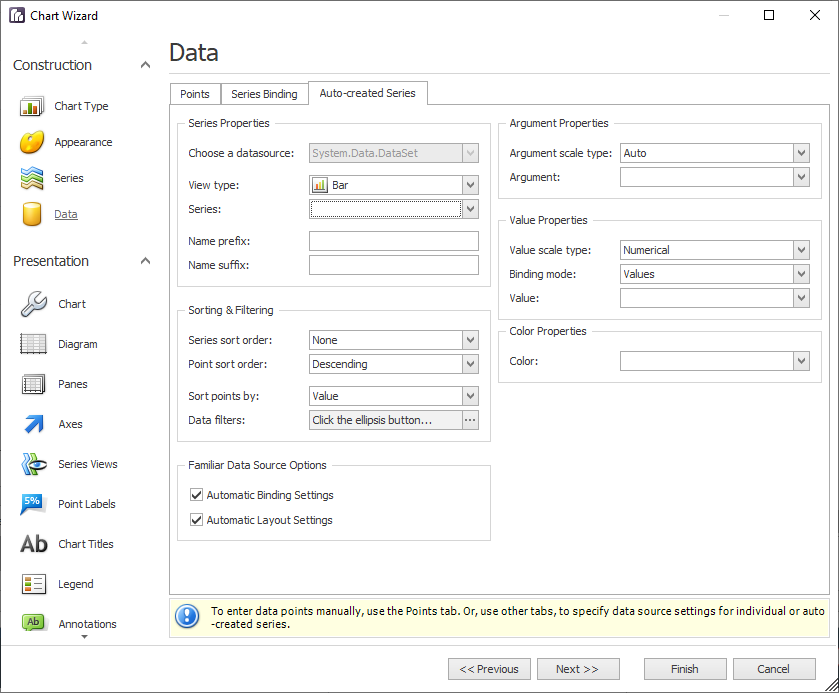 The following illustration demonstrates how it works. 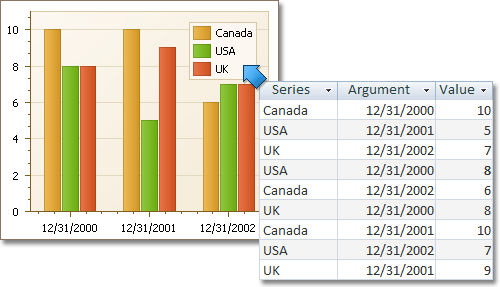 |
Pivot Grid Datasource | For familiar data sources (such as Pivot Grid), you can choose to automatically adjust the binding and layout settings of your chart. When you set a Pivot Grid as a chart's data source, the Pivot Grid Data Source tab becomes available. 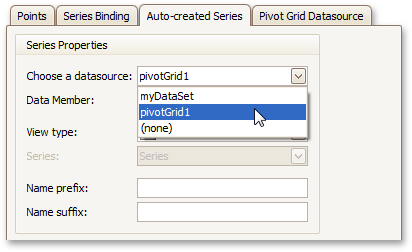 On this tab you can adjust various Pivot Chart options. 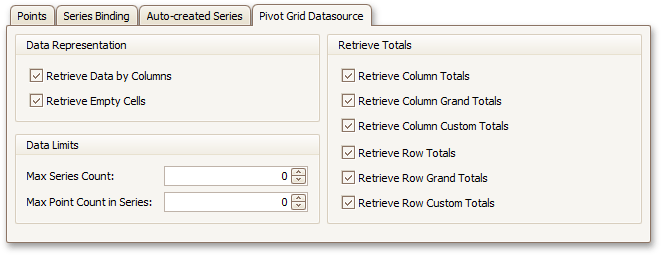 |