Get started with DataMiner
The DataMiner/Data Analysis area of the Analytics client application is where you select, view, and organize manufacturing data to visualize and output as charts, pivot tables, and reports or export as raw data for further analysis. Powerful tools and features are available to help you customize how your data is formatted, visualized, and output. Data manipulation capabilities help ensure that your data is presented exactly as you need it to be for review and analysis by factory personnel.
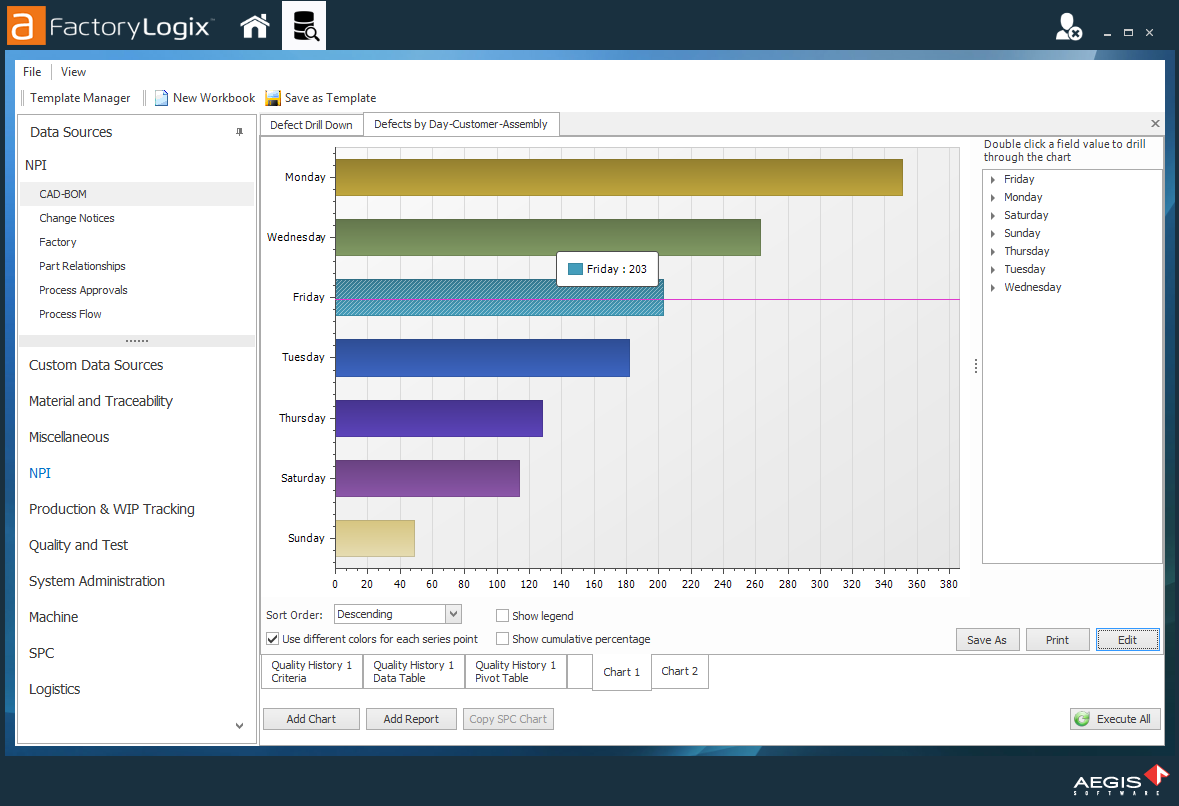
The following illustration shows a sample chart created in DataMiner.
Tip
The high-level steps in the data visualization process are:
Create a data workbook
Select a data source
Search, filter, and format the data
Select an output format
A data workbook can use multiple data sources, so there are almost limitless data combinations available for data visualization with charts, pivot tables, and reports.
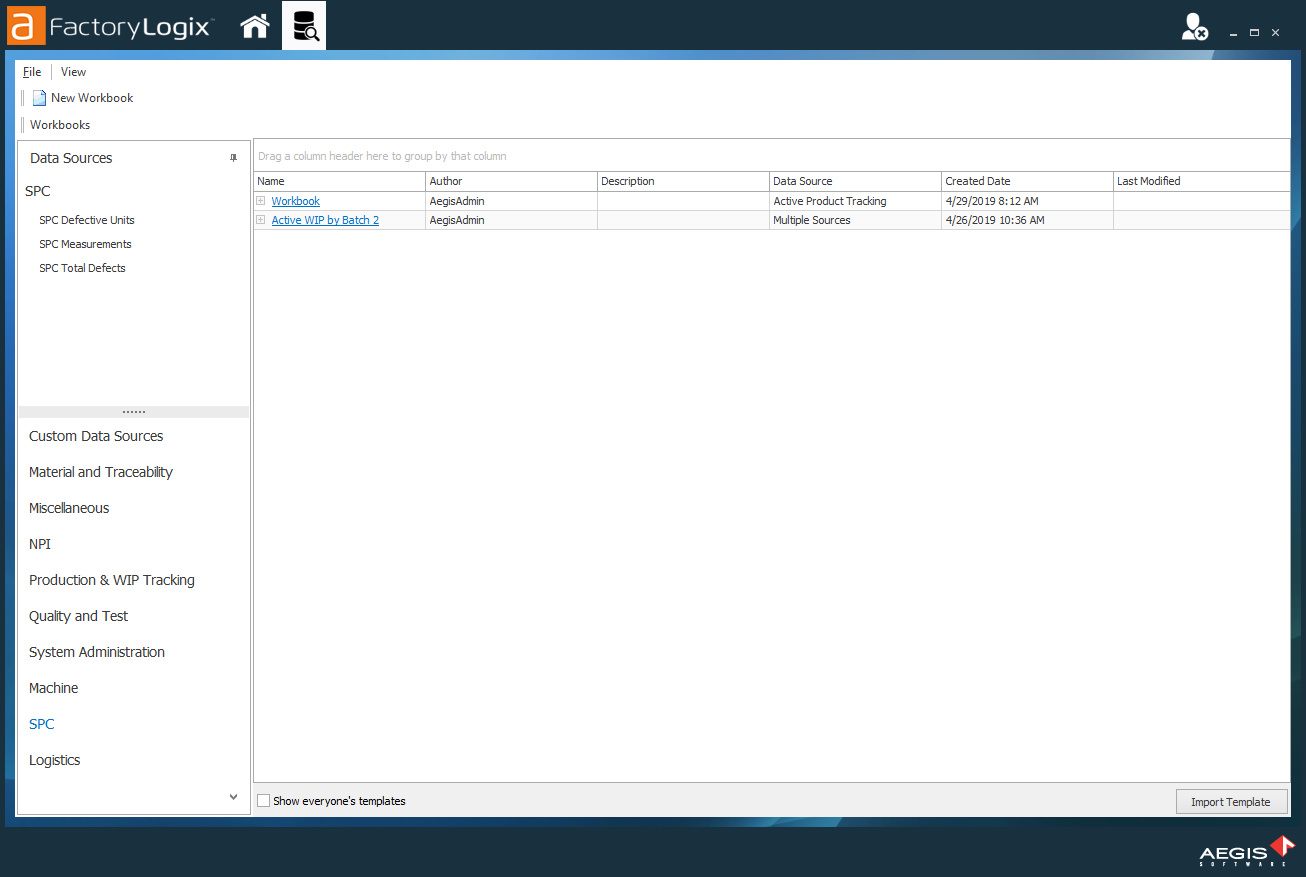
Open DataMiner
Log into the Analytics client application.
Select Data Miner/Data Analysis from the Analytics Home window to display the DataMiner window.