DPMO and opportunity count methodologies
Opportunity count methodologies define how FactoryLogix counts and calculates the number of opportunities in an assembly where a defect or other problem might occur. This calculation is used to generate Defects Per Million Opportunities (DPMO) reports and charts in the Analytics client application.
PPM versus DPMO
Parts Per Million (PPM) is a quality measurement indicating the number of defective assemblies per million produced.
For example, if you have 25 defective pieces in a shipment of 1,000 pieces. 25/1000= .025 or 2.5% defective. . 025 X 1,000,000 = 25,000 PPM.DPMO is a more accurate, “weighted” metric that considers the complexity of the manufacturing process.
To calculate DPMO, you take the number of defects divided by the number of defect opportunities, multiplied by 1,000,000.
DPMO Example
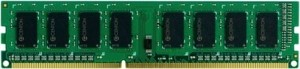
Example Board A is a computer Memory Module with 61 placements
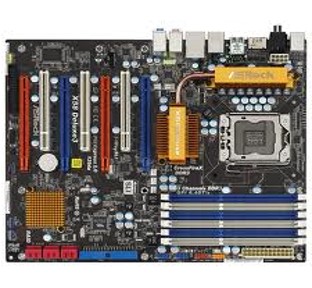
Example Board B is a computer Motherboard with 3,492 placements
The total opportunities for Examples A and B are shown for all population points: a routing station where parts are actually placed/inserted on the PCBs. In this example, a mere three defects found on one assembly per job will result in significantly different end-product DPMO calculations (IPC-7912A) for the two PCBs. Assuming a job quantity of 10 boards in each case, the DPMO results would be:
Example Board A: DPMO = (3/(10*835))*1000000. End-Product DPMO: 359.3
Example Board B: DPMO = (3/(10*22660))*1000000. End-Product DPMO: 13.2
IPC-7912A (End-Product DPMO)
Calculation of DPMO for an End-Item (Finished Product)
Does not account for Model Point Assignments - considers all parts in CAD
IPC-9261 (In-Process DPMO)
Calculation of DPMO for each process in the route
Accounts for Model Point Assignments and No-Pops
Considers chargebacks in defect collection in order to assist in determining the root cause of a defect
Provides clear indication of processes in need of improvement
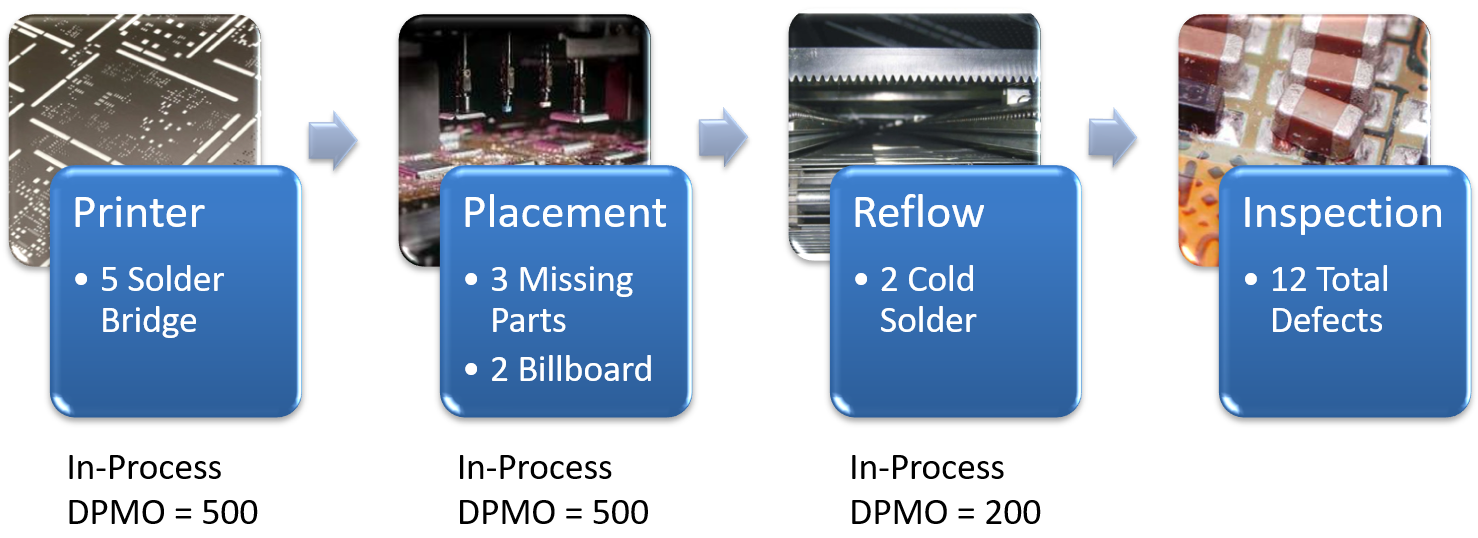
Chargeback example
In this example, using In-Process DPMO (IPC-9261), the specific processes likely responsible for the defects in question are indicated. For this example, assume 1000 opportunities and a Job Quantity of 10. The DPMO results are shown in the following illustration.
Related topics |
|---|