Preview/run a dashboard
When you want to preview a dashboard, you use the Run Dashboard command in iMonitor Designer.
Log into the Analytics client application, then select iMonitor Designer.
Select File > Open.
Locate and select the dashboard you want to run, then select OK.
Select View > Run Dashboard.
The viewer provides a snapshot of how the dashboard will look in the Production client application and the type of data that will be displayed in the gadgets (assuming there is data for the active batch for the data source name selected in the database).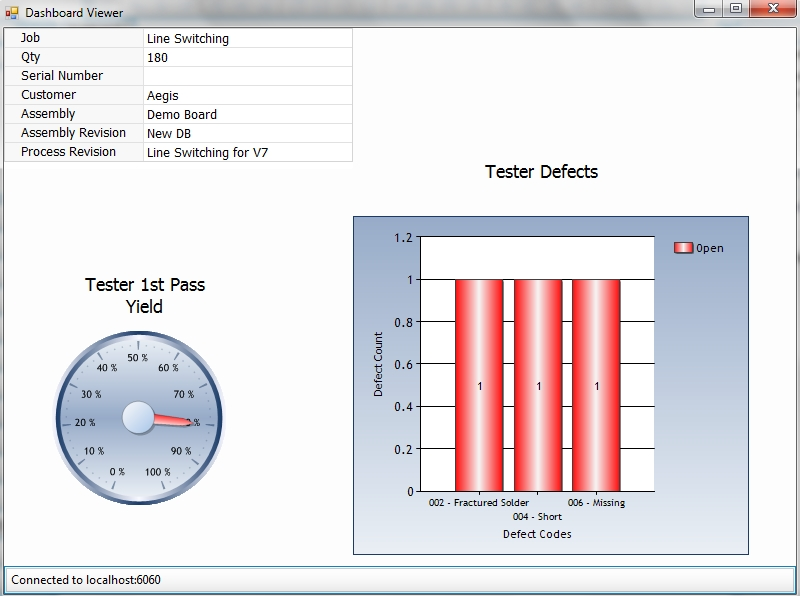
Important
If the gadgets don't populate with data, ensure that data does exist for the active Job and the data source name. Also make sure that the dashboard is connected to the FactoryLogix Realtime Analysis Service which can be seen in the lower left corner of the window. It should show Connected to xxxxx:6060, where xxxxx is the server name where the FactoryLogix Realtime Analysis Service is running, and 6060 is the default port required to communicate to the service.
Select the X in the upper-right corner of the viewer to close the window.
Select the Yield gadget, then open the Properties box and expand all the items under Range Settings
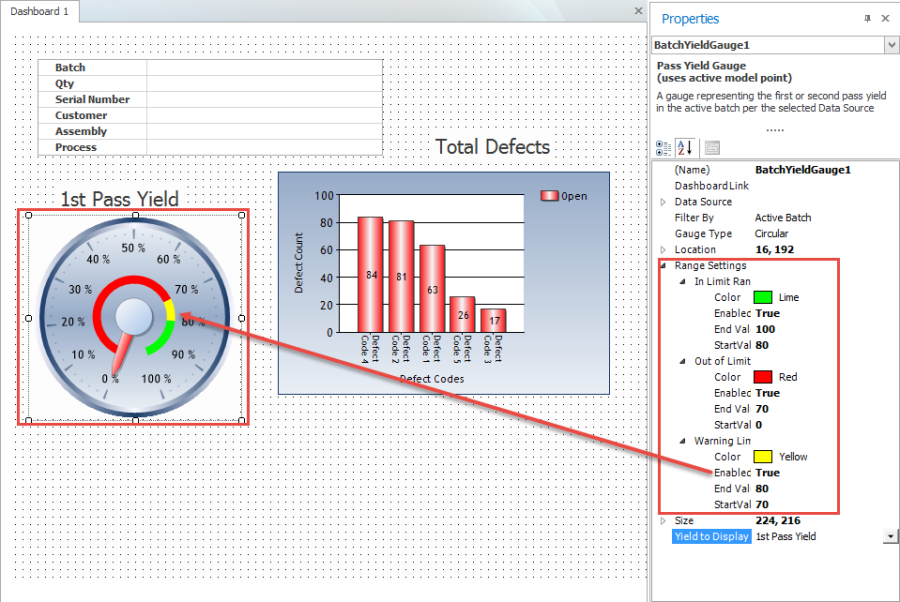
Set all three limits to Enabled: True to set a colored bar for the In Limit, Warning Limit, and Out of Limit ranges.
Select Bar from the Gauge Type in the Appearance category, then select View > Run Dashboard.
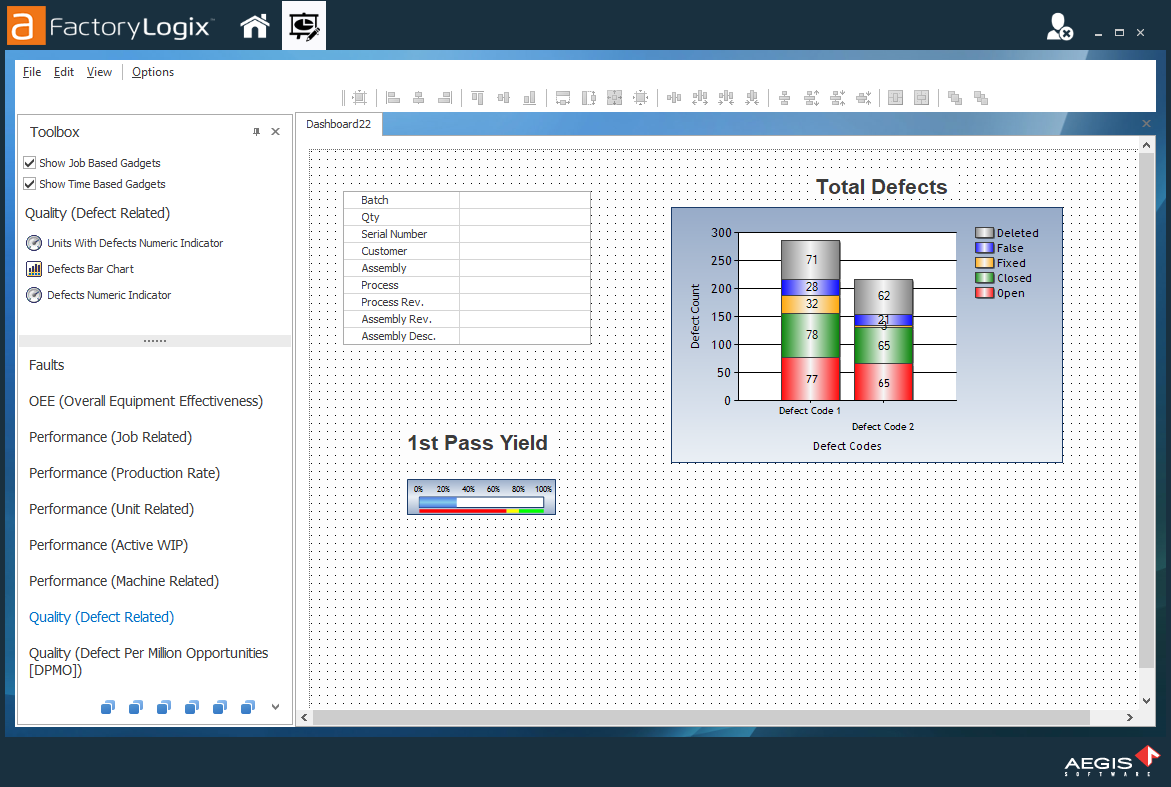
You can now see the changes as they will look when viewed in the Production client application.Close the dashboard viewer and select the Defects bar chart.
In the Properties box, select Defect Statuses to Display in the Design category.
Select Deleted, False, Fixed and Closed (the Open defect is selected by default).
Select Number of Most Critical Items in the Point Display Settings category, change the quantity to 2 (the default quantity is 5).
Select View > Run Dashboard to view the changes in real-time.
Note
For a complete list of default port settings, see FactoryLogix default port settings.