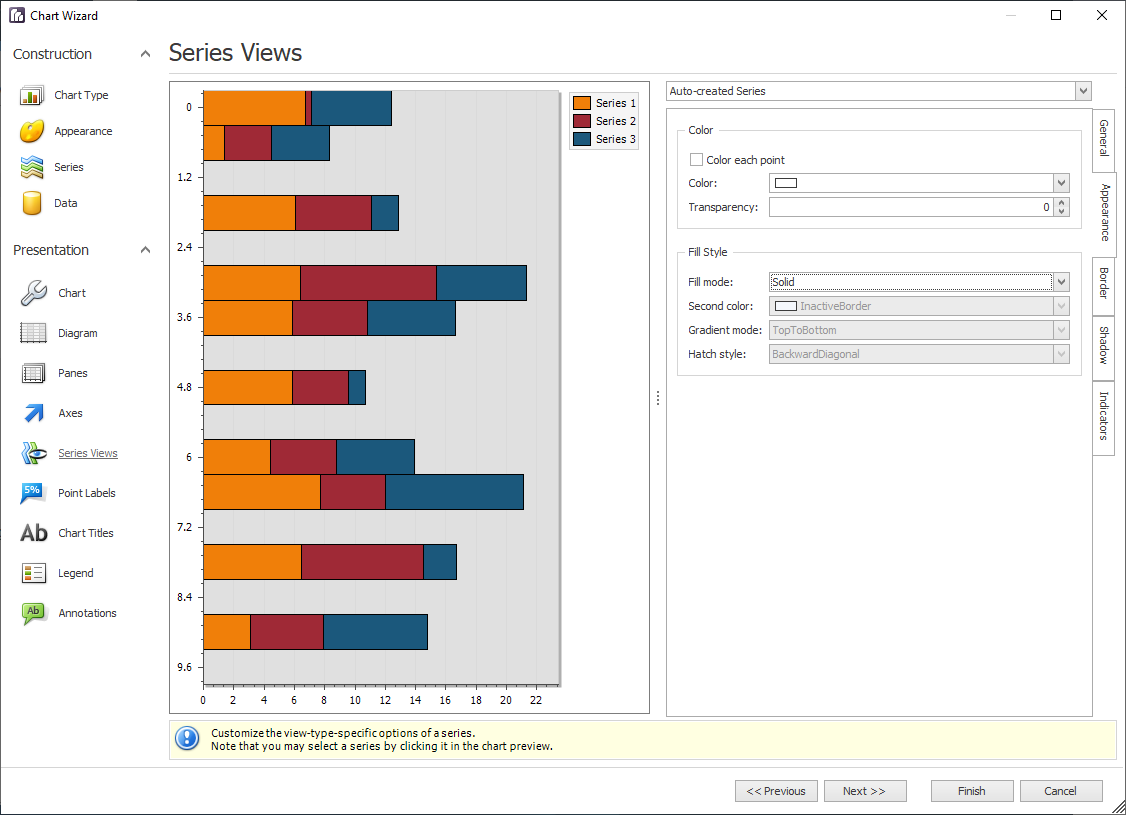
Skip table of contents

Series Views page

Use the options on the Series Views page to do the following:

  • Customize the view-type-specific properties of series

  • Customize the appearance and border settings of series

  • Add or remove financial indicators (Fibonacci indicators, trendlines and regression lines)


Chart wizard Series Views page

Item

Description

Chart preview area

Previews a chart's layout.

Note

You can select a series to be modified directly in the chart preview area.


Chart Preview example

Series selector

Specifies a series to be customized.

Options tabs

  • General
    Specifies a series bar's width, distance, color, transparency, and so on.

  • Appearance
    Specifies a series color, transparency and fill style. Additionally, determines whether series points should be painted individually.

  • Border
    Determines whether a series border should be visible and defines its color and thickness.

  • Shadow
    Specifies whether a series' shadow should be visible and determines its color and size.

  • Indicators
    Allows you to add or remove indicators of a required kind (Regression Line, Trend Line, Fibonacci Arcs, Fibonacci Fans, Fibonacci Retracement, and others).

JavaScript errors detected

Please note, these errors can depend on your browser setup.

If this problem persists, please contact our support.