View project charts and user allocations
On the right side of the Projects window, dynamic charts are generated and updated automatically as you modify project details and users' task statuses. These charts are a useful way to see the health of your projects at a glance. You can also open each chart or user allocation profile to see detailed data. There are six charts:
Chart | Description |
|---|---|
Projects by Customer for this Month | Groups the number of customers by project for the current month. |
Projects by Customer for This Year | Groups the number of customers by project for the current year. |
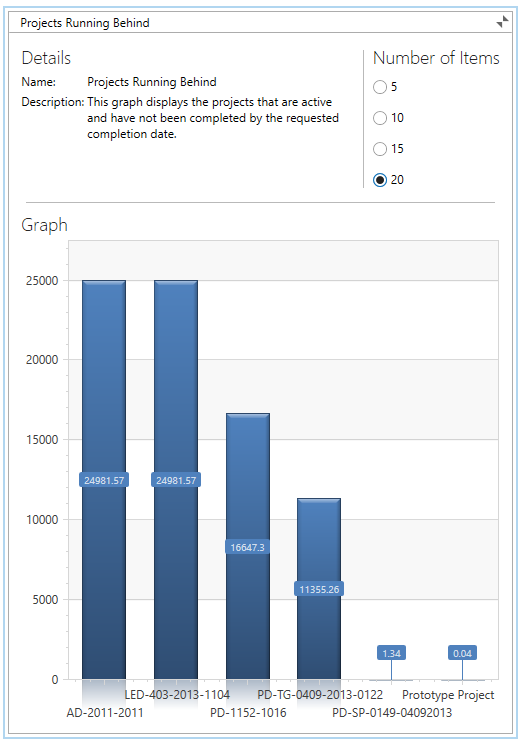
Projects Running Behind | Displays projects that are active and have not been completed by the requested completion date. |
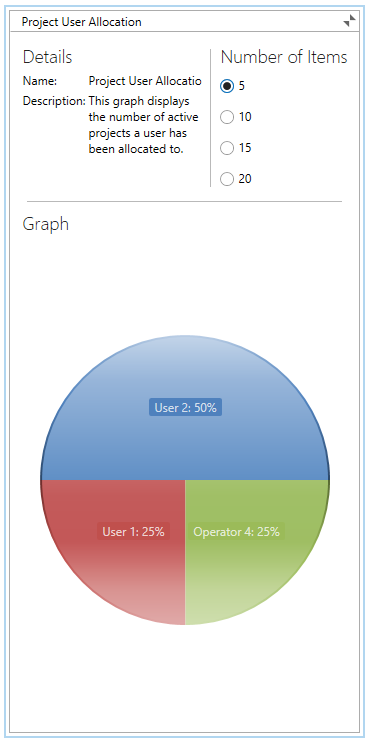
Project User Allocation | Displays the number of active projects a user is allocated to. |
Average Time Over Completion Time by User | Calculates the average excess time it takes a user to complete project tasks for the requested completion date. |
Average Time Over Completion Time by Customer | Calculates the average excess time it takes a user to complete project tasks for the requested completion date of a customer. |
Log into the NPI client application.
Select Process Engineering
 > Schedule Projects to display the Projects window.
At the bottom of the window, drag the horizontal scroll bar to the right (or resize the window).
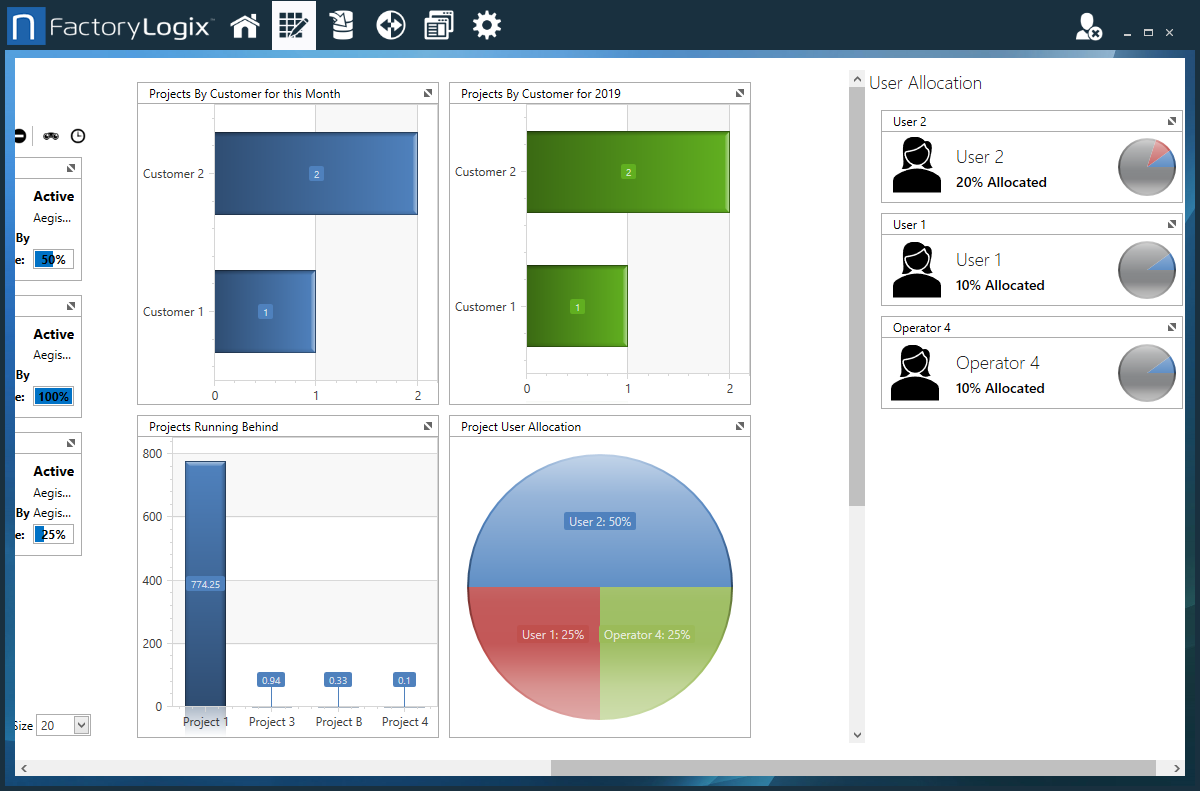
On the right side of the window, current user allocations are displayed using pie charts and percentages.To expand details for a user, select the double arrow
 icon.
icon.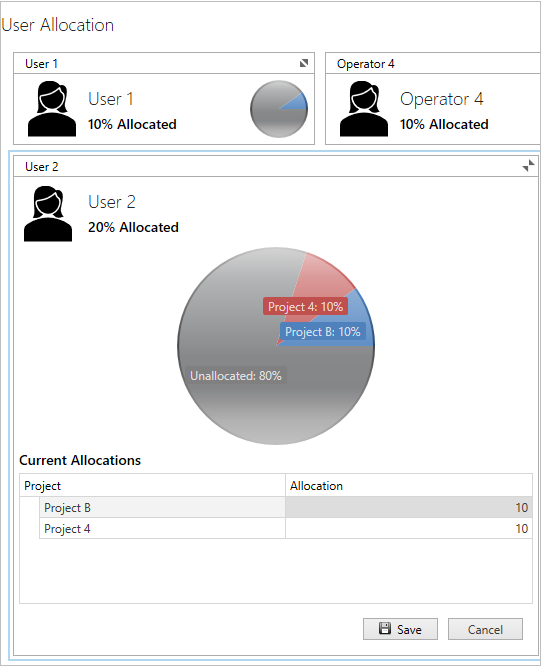
When you expand a user's allocation, you see a list of projects the user is assigned to and their allocation percentage for each project.Select a chart, then select the double arrow
icon to expand the details.To change the number of items displayed on the chart, select a value under Number of Items.
View the on-time percentage for all projects
The left side of the Projects window has an on-time percentage gauge that updates automatically as projects change. The on-time percentage is the success rate for on-time projects in your FactoryLogix system.
Note
If you use the filtering options to change the display of projects in the window, the gauge also changes to reflect the on-time percentage for the filtered projects.

Search and filter projects
You can search for projects and filter the search results. When your search results are displayed, the on-time percentage gauge will change and the charts on the right side of the Projects window will also update automatically to reflect the project search results.
Log into the NPI client application.
Select Process Engineering
> Schedule Projects to display the Projects window.Select the Search
 button (the binoculars).
In the Filters dialog, use the Duration drop-down to search for projects by duration.
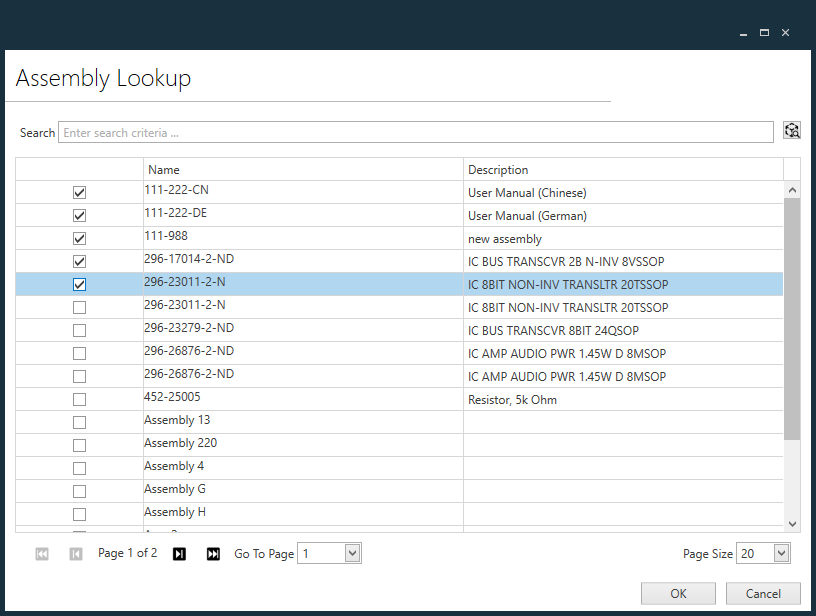
Select the Project, Process, Assembly, or User filter to display a Lookup dialog.
Select the icon to the right of the Search box to display all projects, processes, assemblies, or users (depending on your initial filter selection).
Use the check boxes to make your selections in the dialog, then select OK.
Note
To cancel current filtering settings, select the ellipsis (…) next to a filter to open the dialog, then select Cancel.
Select the Update Filter button to complete the search. Projects matching your filtering criteria are displayed in the Projects window.

Related topics |
|---|