iMonitor Viewer

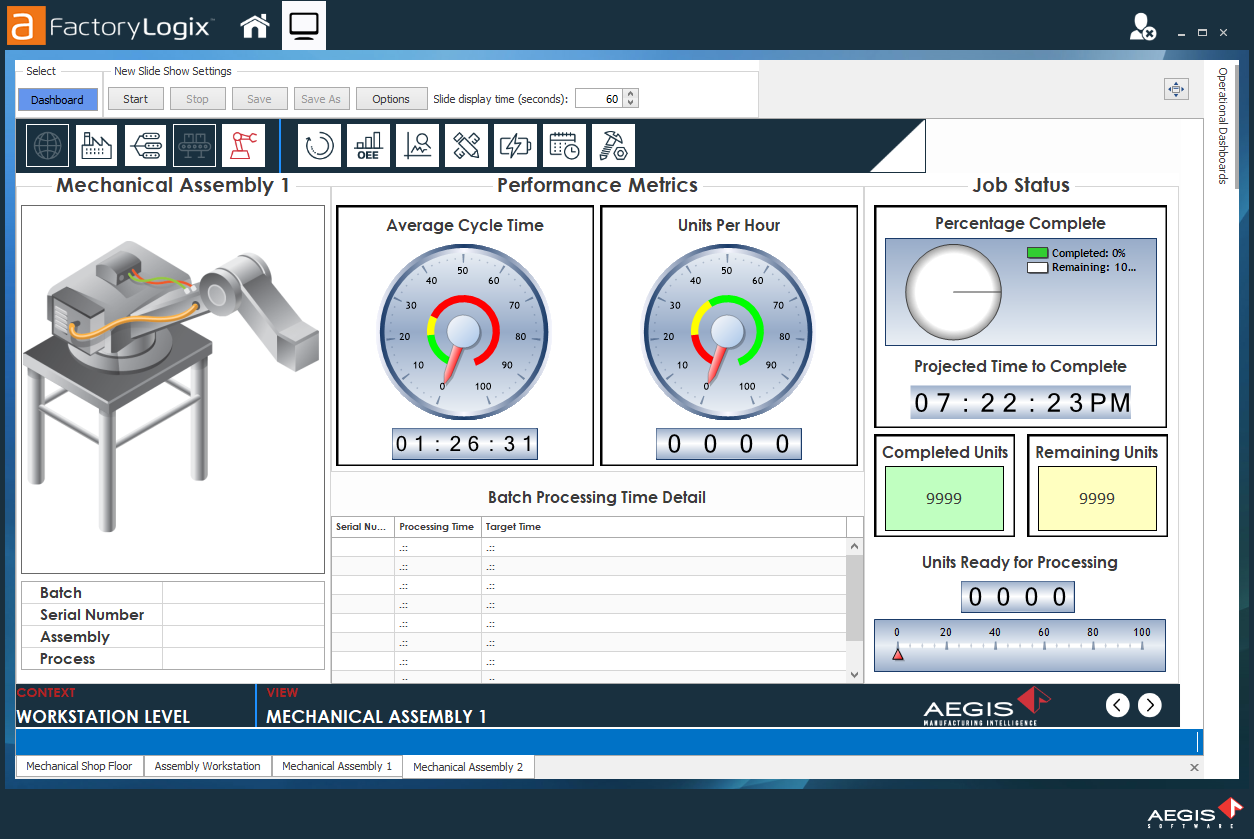
The iMonitor Viewer area of the Analytics client application is where you set up one or more dashboards as a slide show to run during production to provide valuable, real-time manufacturing data to factory floor personnel.
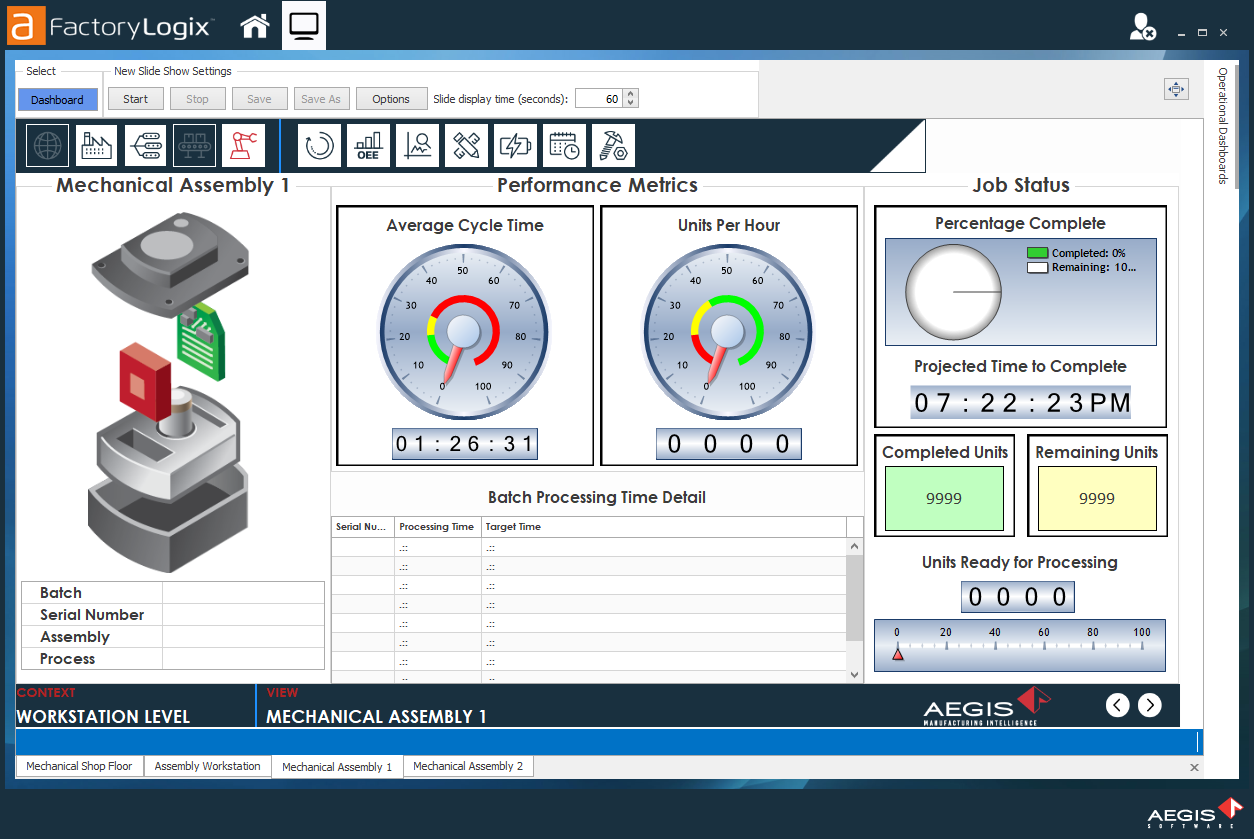
Each dashboard you select is one slide in a slide show and you can combine multiple dashboards into a slide show. For example, you might design a slide show with multiple dashboards/slides related to each specific factory area, then set up additional slide shows for other factory area data such as Inspection, Re-Work/Repair, and Packout. The following example uses four dashboards with Assembly-related data for a slide show. Across the bottom of the window you can see the dashboard names Mechanical Shop Floor, Assembly Workstation, Mechanical Assembly 1, and Mechanical Assembly 2. Each dashboard/slide will display for 60 seconds.
Dashboard types
There are three types of dashboards:
Live dashboards display real-time manufacturing information that is updated continuously to reflect shop floor activity in real-time.
Operational dashboards use a chart created in DataMiner and display it as part of a slide show along with other dashboards. These dashboards are updated at an interval, such as every 15 minutes, for example. Operational dashboards typically display bar chart data.
Dashboard slide shows are the slide shows you save in iMonitor Viewer using the Save As command. Once saved, you can open a slide show in the viewer and run it using the saved slide display timing information and other options.
Set up, run, and save a slide show
Log into the Analytics client application, then select iMonitor Viewer.
Select the Dashboard button in the upper-left corner of the window.
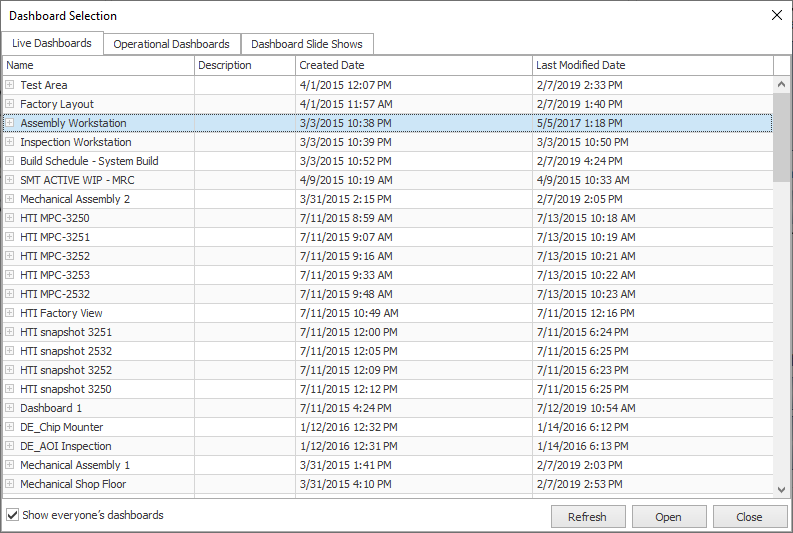
On the Live Dashboards tab, select a dashboard to use for the slide show, then select Open.
Note
Optionally, you can select an Operational dashboard or previously-saved dashboard slide show using the other tabs in the Dashboard Selection dialog.
To add more dashboards/slides to the slide show, repeat Step 3.
When you are finished selecting dashboards/slides, select Close.
Select the Options button to display slide show settings.
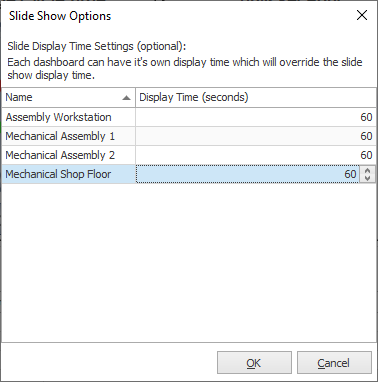
Under Display Time (seconds), select the number of seconds each dashboard/slide will display, then select OK to return to the iMonitor Viewer window.
Note
Each dashboard can have a different display time—these settings will override the Slide display time (seconds) setting in the iMonitor Viewer window.
(Optional) Next to Slide display time (seconds), enter the number of seconds all dashboards/slides will be displayed. (If you selected different timings in Step 7, this setting will be ignored.)
Select the Start button to begin the slide show.

To stop the slide show, select the Stop button.
With the slide show still open, select the Save As button at the top of the iMonitor window.
Name the slide show, then select Save.
Note
You can also open and run a dashboard from iMonitor Designer. See Preview/run a dashboard for more information.
Related topics |
|---|