Modify and customize a report
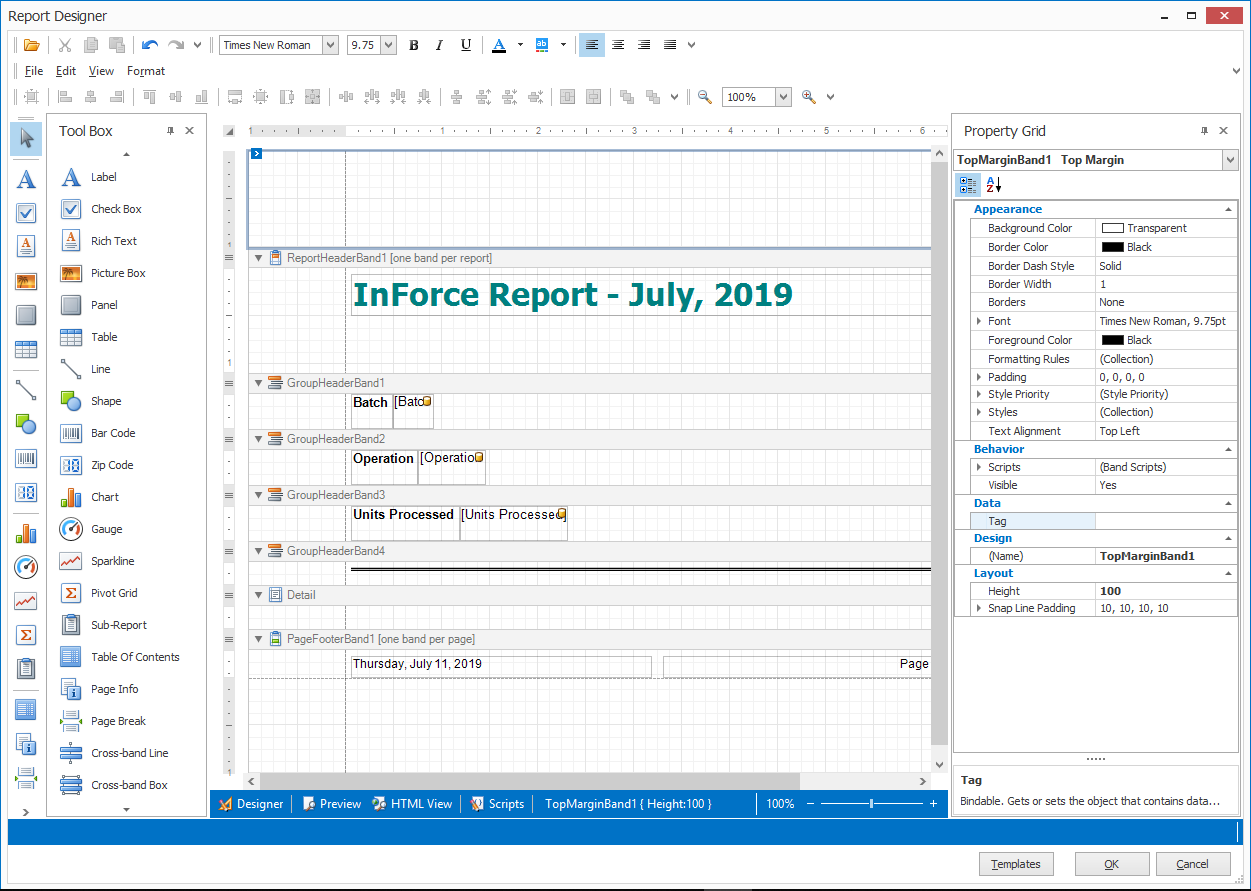
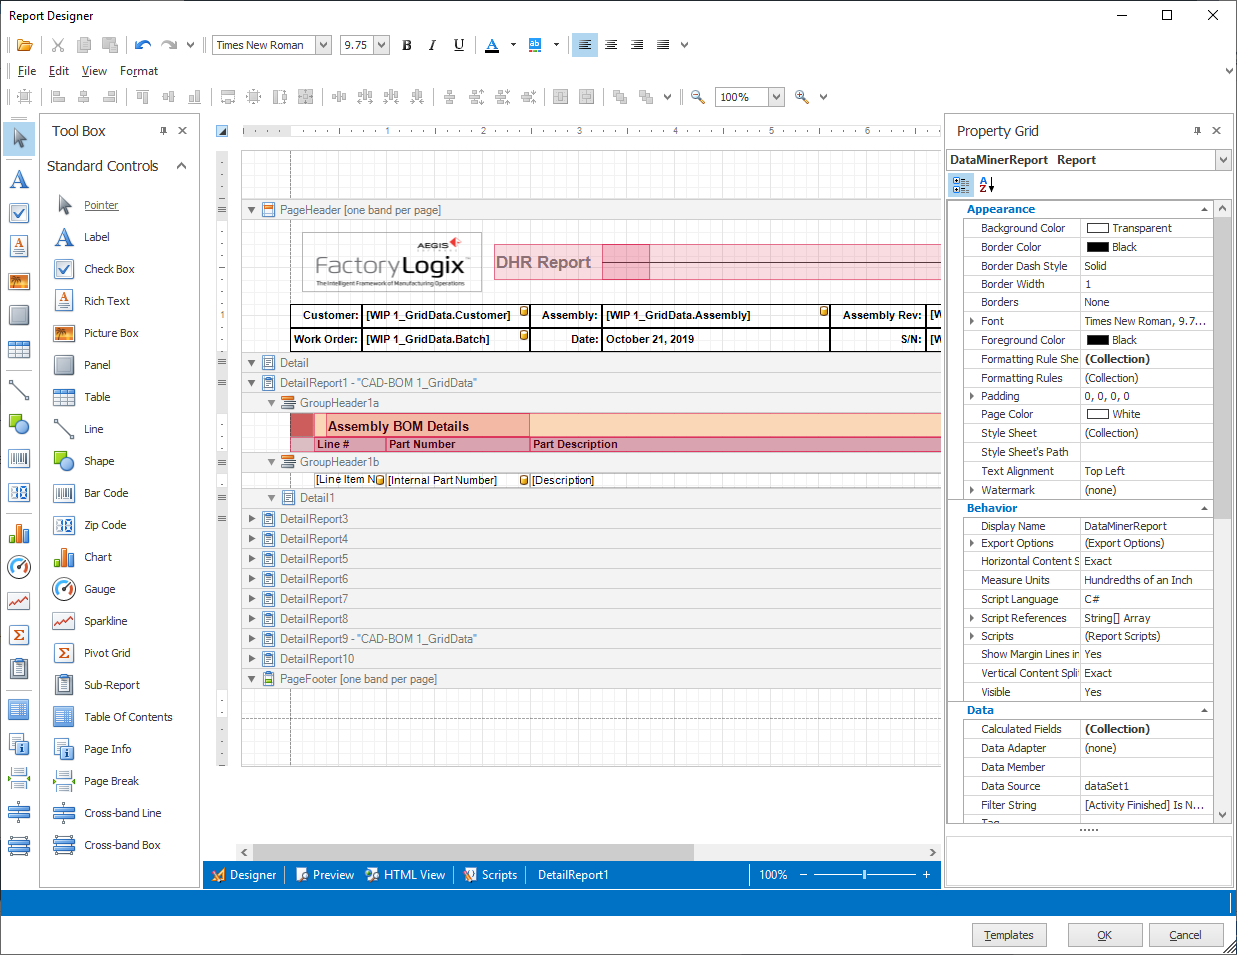
You can modify an existing DataMiner report or create a new report in the Report Designer window using options included in the Tool Box and the report Property Grid. These controls provide tools and options that help you fully customize your report data. Both controls are displayed when you open the Report Designer.
The Tool Box has tools to add elements to a report such as sub-reports, charts, tables, gauges, and a table of contents.
The report Properties Grid allows you to add additional fields to a report, modify the layout of each field including fonts, field data, summary information, and so on.
Auto-hide the controls
To auto-hide the Tool Box or report Property Grid control and maximize the window space for report data, select the push pin
 button in the upper-right corner of the control.
The control collapses into a tab on the side of the Report Designer window. (To dock a control, select the push pin button again and the control stays visible in the Report Designer window.)
Tool Box tools
The following table describes how you can use the Tool Box tools to customize and enhance a report.
Tool | Description |
|---|---|
 | Selection tool for all items in the Report Designer window. |
 | Creates a plain text label. |
 | Creates a check box. Enter the desired text, then select a font, style, color, and other text options for the check box label. |
 | Creates a Rich Text text box. Enter the desired text, then select a font, style, color, and other text options for the text box. |
 | Creates a picture frame for a graphic. |
 | Creates a panel. |
 | Creates a table. |
 | Creates a horizontal line you can use as a divider for report sections. |
 | Creates a circular shape. Ctrl+drag to rotate the shape. |
 | Creates a barcode image. |
 | Creates a zip code field. |
 | Displays the Chart Designer window where you can select data to create a chart for a report. |
 | Adds a gauge to a report. |
 | Create a small chart in a table or worksheet cell that provides a visual representation of data. Sparklines show trends in a series of values or highlight maximum and minimum values. |
 | Creates a pivot table in a report. |
 | Creates a sub-report. |
 | Creates a table of contents for a report. |
 | Inserts a page number, for example 1/1. |
 | Inserts a manual page break in a report. |
 | Inserts a horizontal (cross) band line in a report. |
 | Inserts a cross-band box in a report. Right-click the box to view options for editing and reordering bands. |
Select and run a report template in DataMiner.
Select the report tab, then select the Edit button to open the Report Designer window.
Select the report title.
Note
As you select headers, report bands, or other data items, the information in the Property Grid updates to display the values for the currently-selected item.
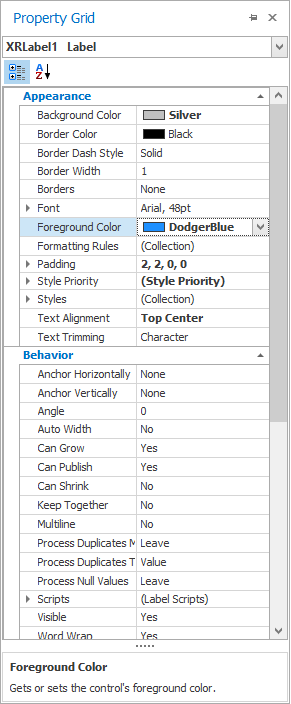
In the Property Grid, use the Appearance selections to change the title background color, the font and color, and other options to customize the look of the report.
Note
When you select an option on the Property Grid, a description of the option displays at the bottom of the grid to help you understand what the option does.
As you make changes, you can see the results in the Report Designer window preview mode by selecting View > Preview.
Click the Cancel button in the lower-right corner of the window to discard the previous changes.
Select Edit in the lower-right corner of the window to resume editing the report.
To add a picture (a company logo, for example) to the report, expand the ReportHeaderBand data box by dragging the top of the PageHeaderBand down to increase the area for the ReportHeaderBand.
Drag the Picture Box from the Tool Box onto the expanded area of the ReportHeaderBand.
Note
You should only add charts and pivot tables to a report in the ReportHeaderBand or PageFooterBand (not the Detail band)
From either Property window, select the browse button (...)for the image, locate and select a picture, then select Open.
Tip
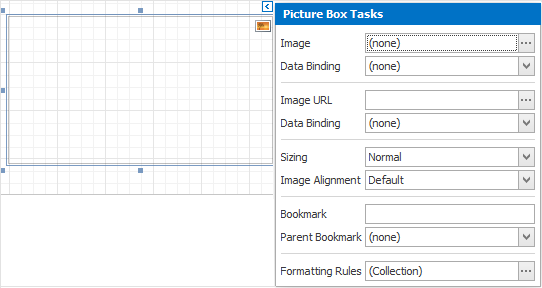
Select the Blue arrow in the upper-right corner of the picture placeholder to display the Tasks dialog. The dialog contains the same property values as the Property Grid but is a quick way to get to the most common properties of a report component).
Drag the handles on the picture placeholder rectangle to resize the picture box to the desired size or use the Size option on the Property Grid.
When you are finished editing the report, select OK to update the report in the workbook.
Save the template to make all the changes available whenever someone selects the template.