Create a data-bound report
After you organize data in DataMiner, you can use the Report Wizard to create custom reports. There are three basic report types you can create: Empty, data-bound, and label. This topic focuses on using the Report Wizard to create a data-bound report.
To create a new data-bound report with the Report Wizard, follow these steps.
Log into the Analytics client application.
Select Data Miner/Data Analysis from the Analytics Home window.
Select a previously-saved workbook template for your data source or build your data set manually.
Organize the data you want to use in a report on the Data Table tab. (See Get started with DataMiner for details about working with data.)
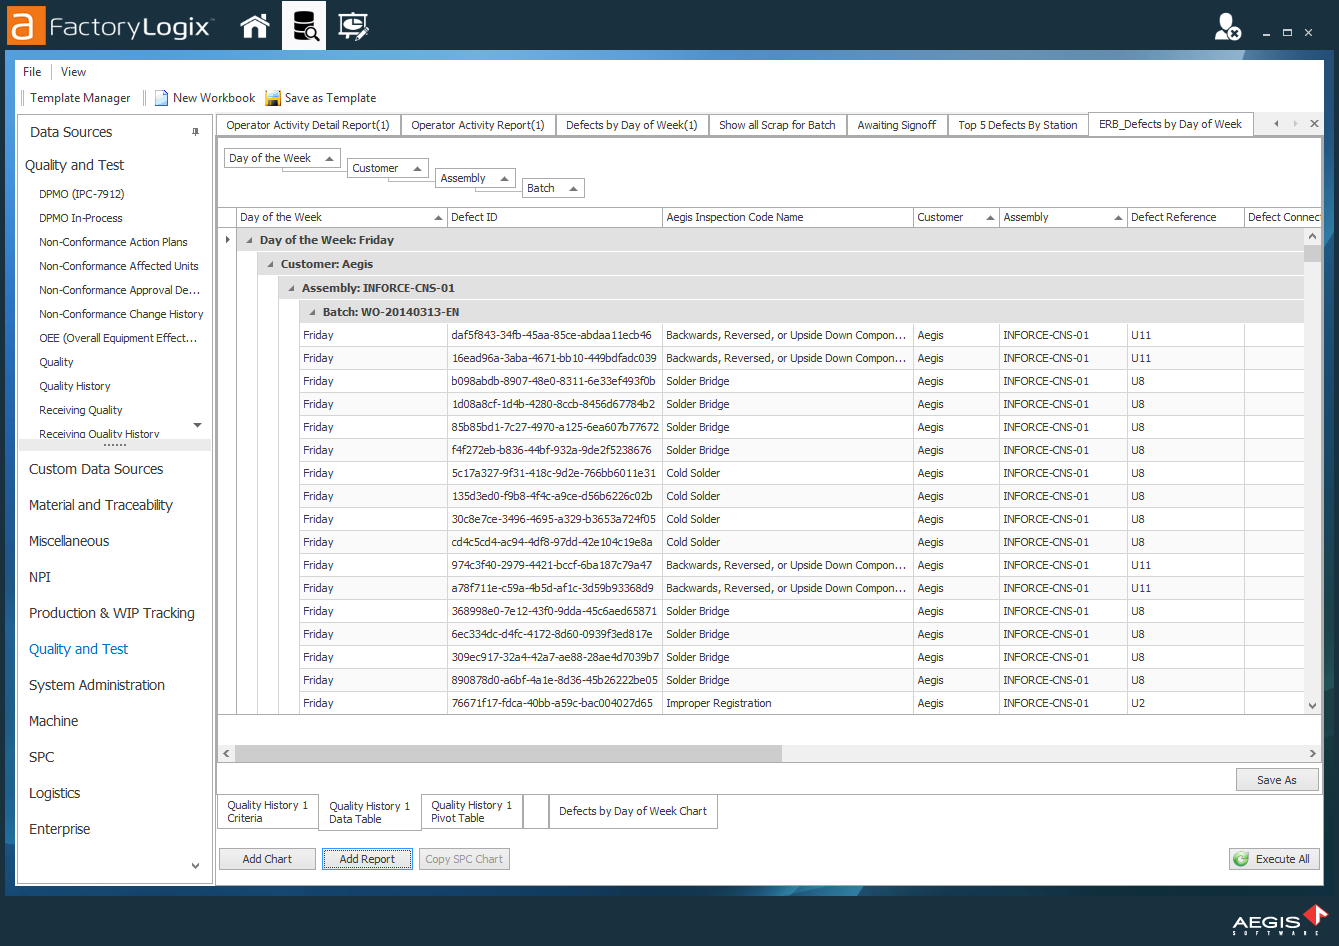
Select the Add Report button in the lower-left corner of the workbook to open the Report Designer window.
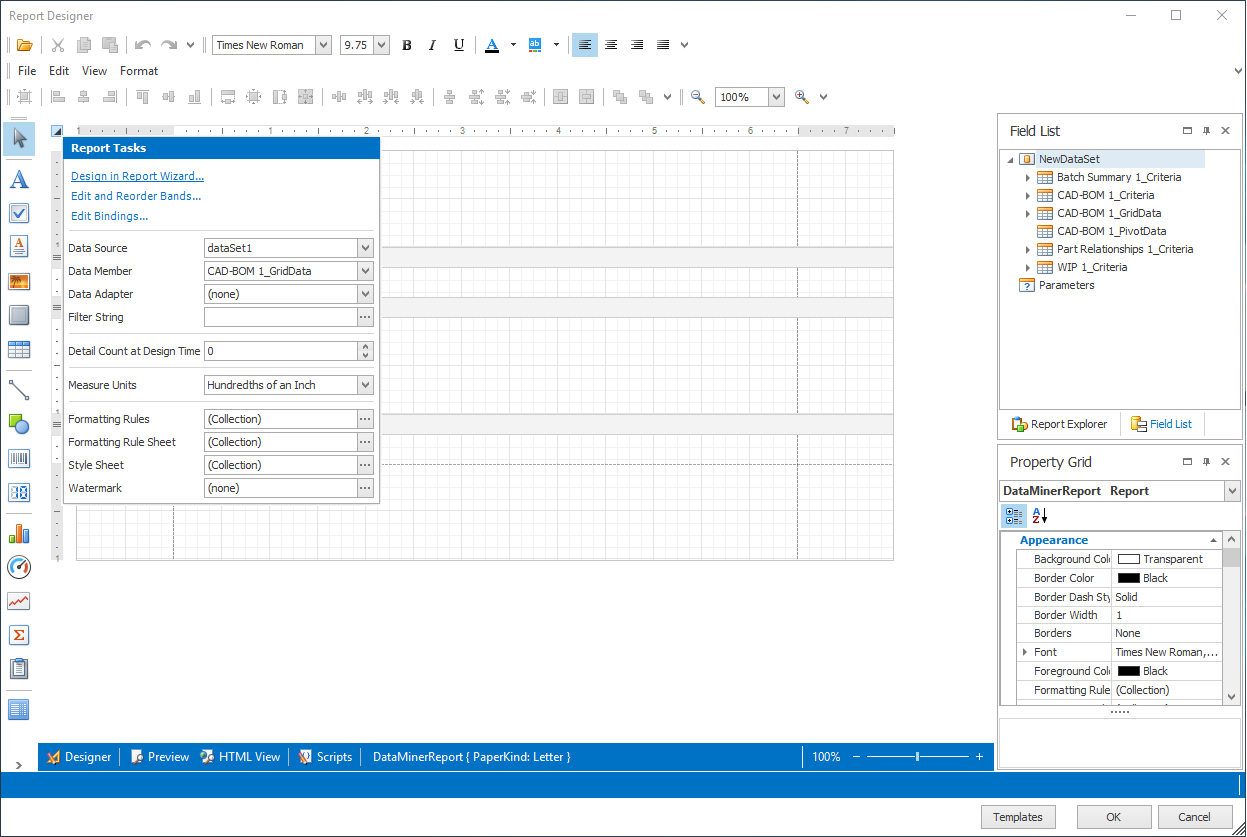
In the Report Designer window, select the small arrow in the upper-left corner of the page, then select Design in Report Wizard.
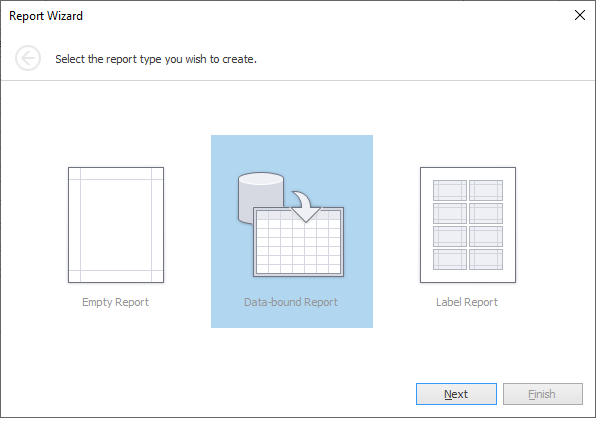
Select Next to use the default Data-Bound Report type.
Next you select data columns to display in the report.
Select the fields for the report from the Available fields list on the left side of the page.
Tip
Ctrl+click to select multiple non-contiguous fields; Shift+click to select multiple contiguous fields. To move all fields to the Fields to display in a report column, select the double-arrow (>>).
Select the right arrow (>) to move the field selections to the right side of the page under Fields to display in a report, then select Next.
Any column on the right side of the page will be included in the report.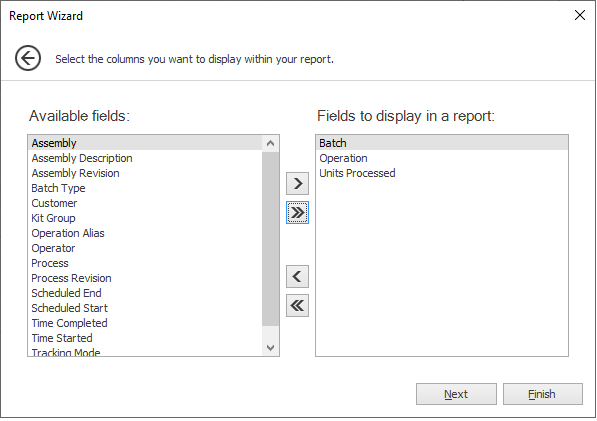
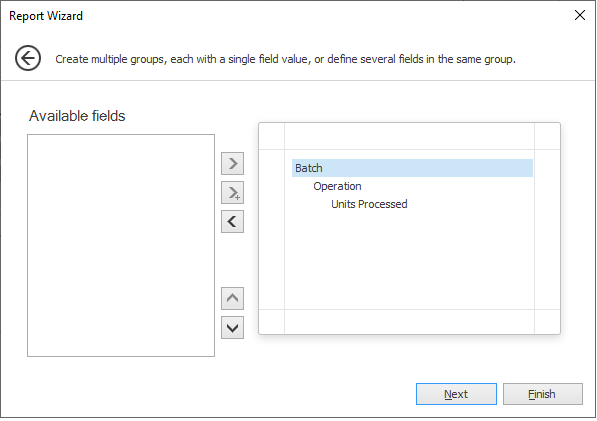
The next page allows you to group selected columns of data for the report.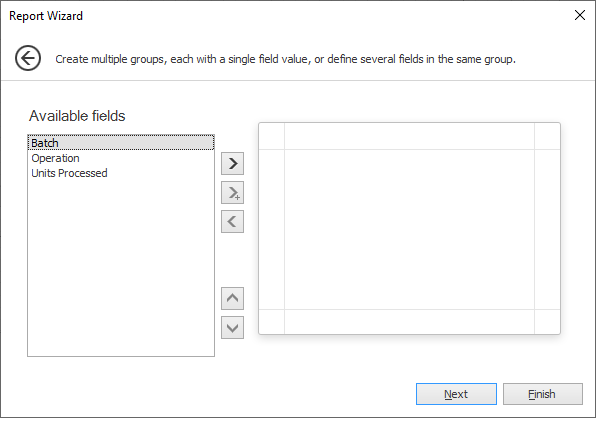
Make your selections, then select the right arrow (>) to move the selected items to the right side of the page.
Note
You can also change the priority (sort) of the grouping with the up and down arrows. The grouping will be shown in Blue, the data points will be shown in Black.
The Summary Options page will display next, but only if the wizard determines that the data values are numeric and will indicate the column name (field name) in the summary window. For this report we don't need a summary, so no selection is made.
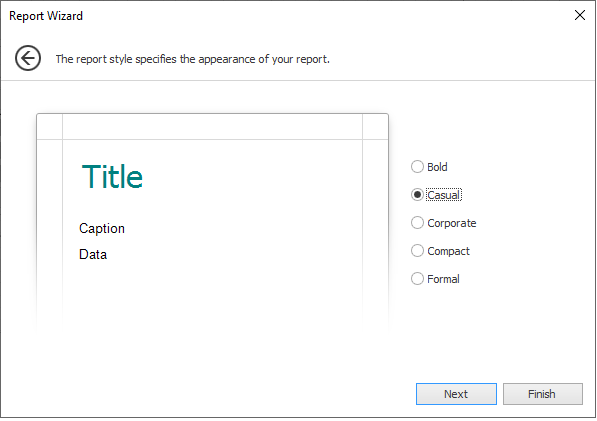
Select Next to display the report style page, select the desired report style, then select Next.
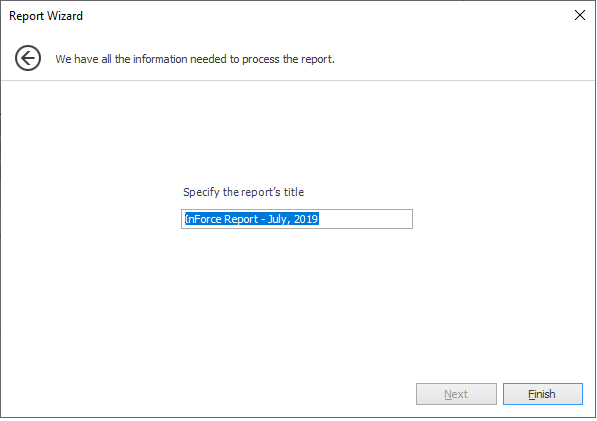
Enter a report title in the Specify the report's title field, then select Finish.
Now you can see your selections in the Report Designer window with formatted headers, columns, and data to be included in the report.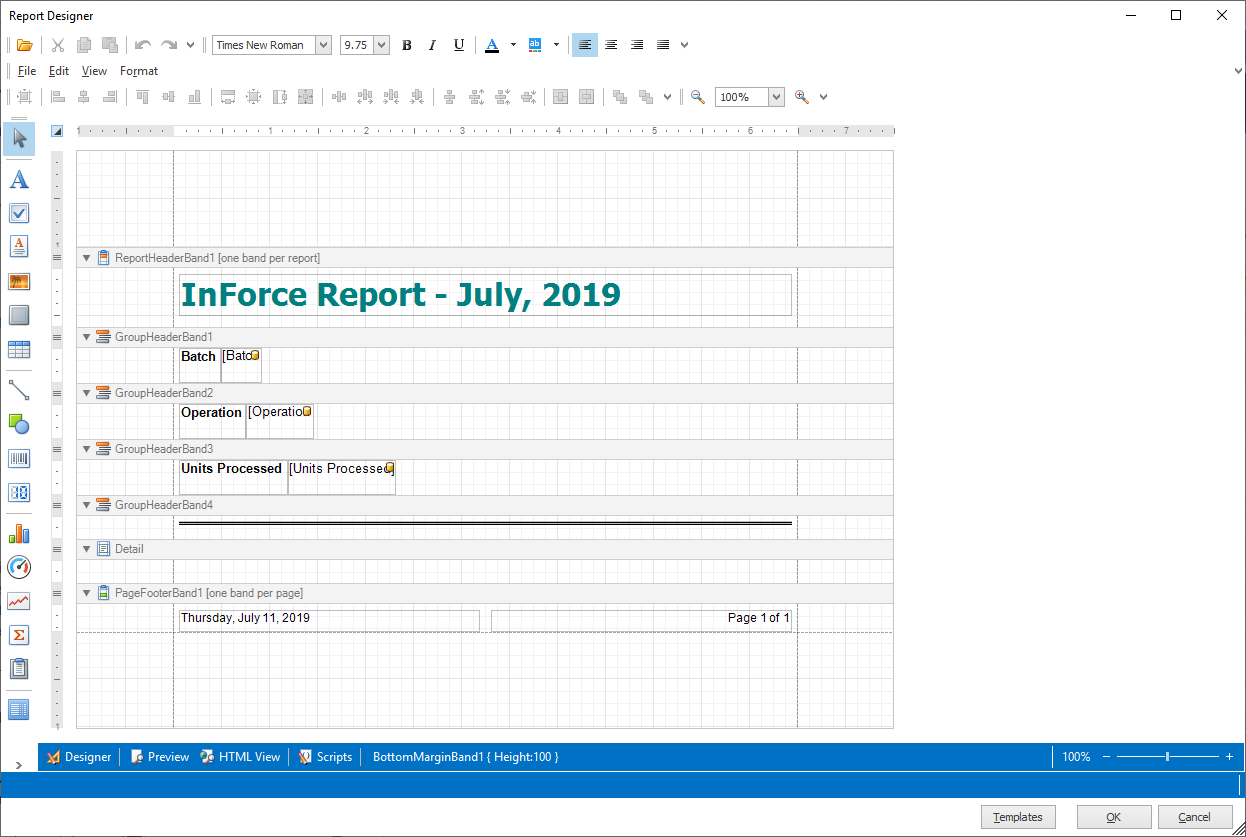
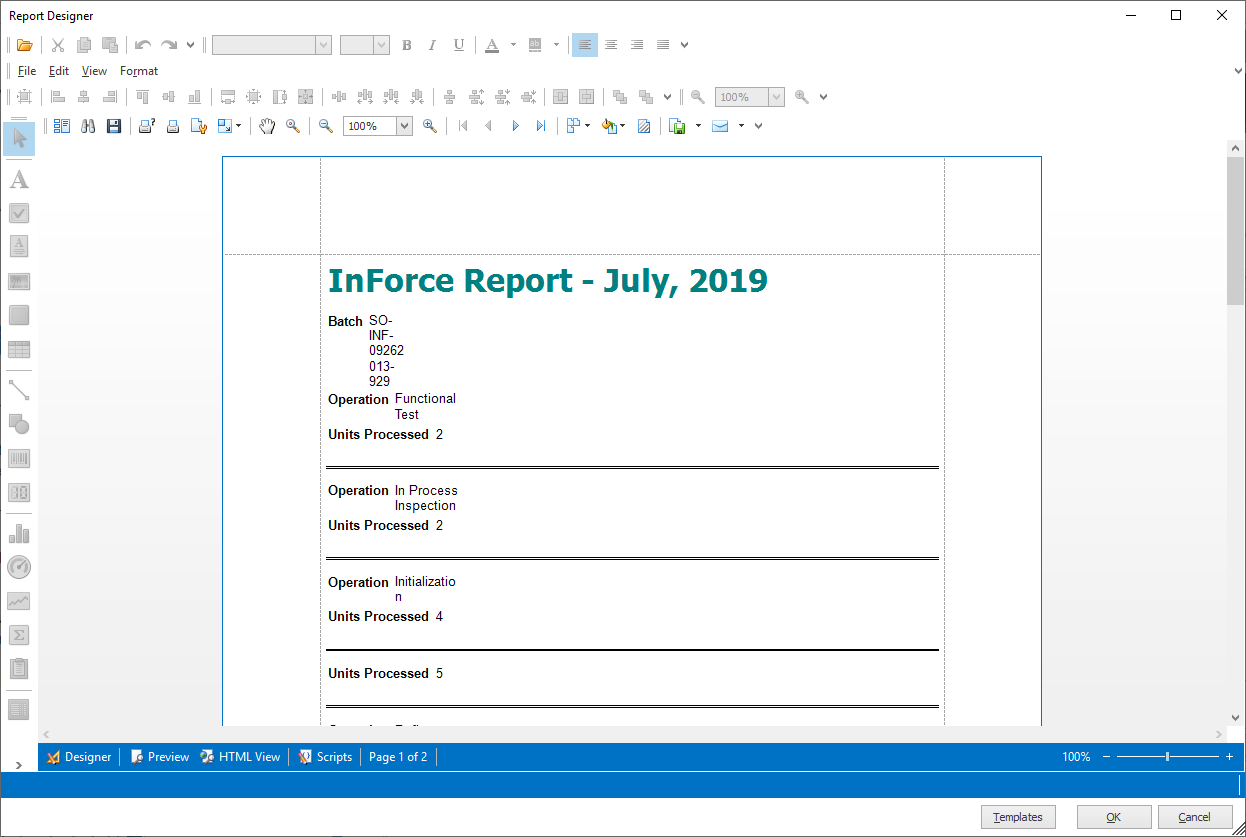
Select Preview at the bottom of the window to see what the report will look like when it is added to the workbook. You can see that the report contains the columns and data that you defined in the report wizard.
Select Designer at the bottom of the window to return to the Report Designer window.
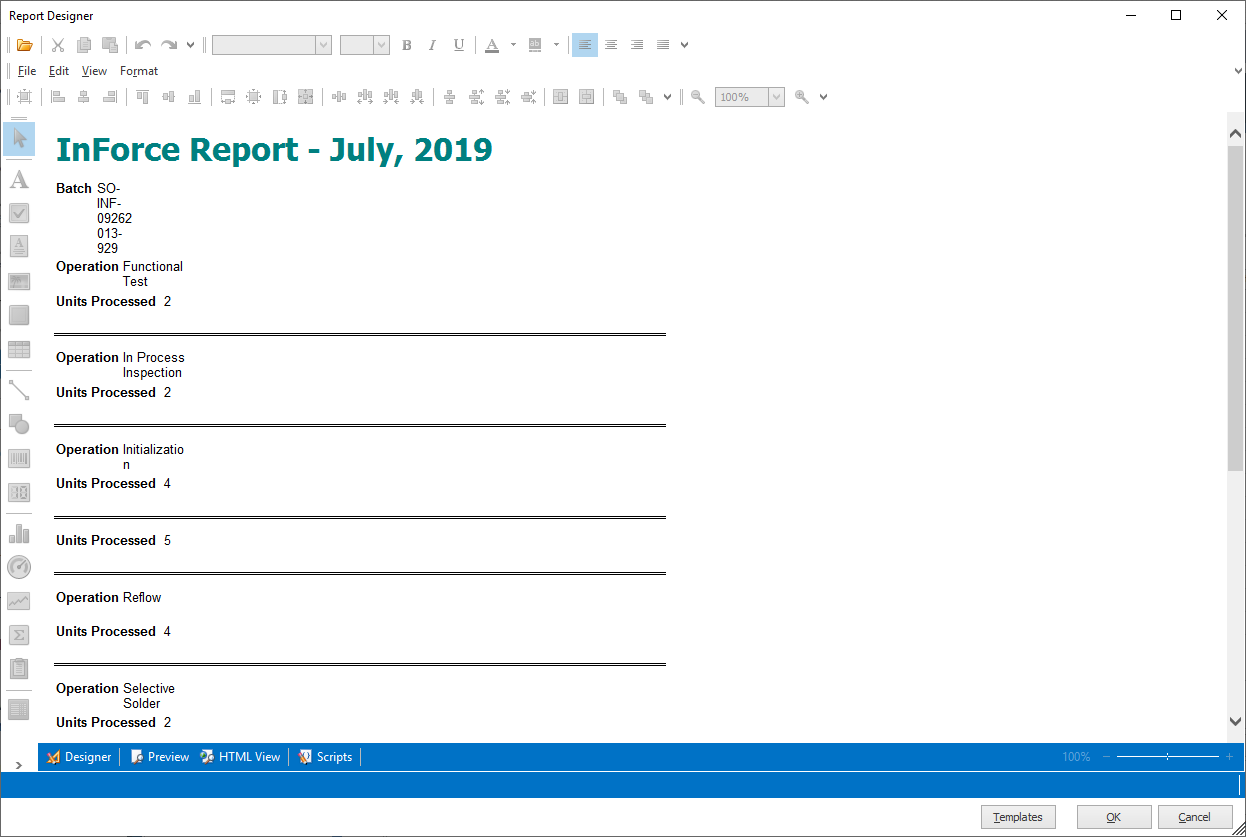
Select HTML View to see what your report will look like in HTML format.
Select Designer at the bottom of the window to return to the Report Designer window
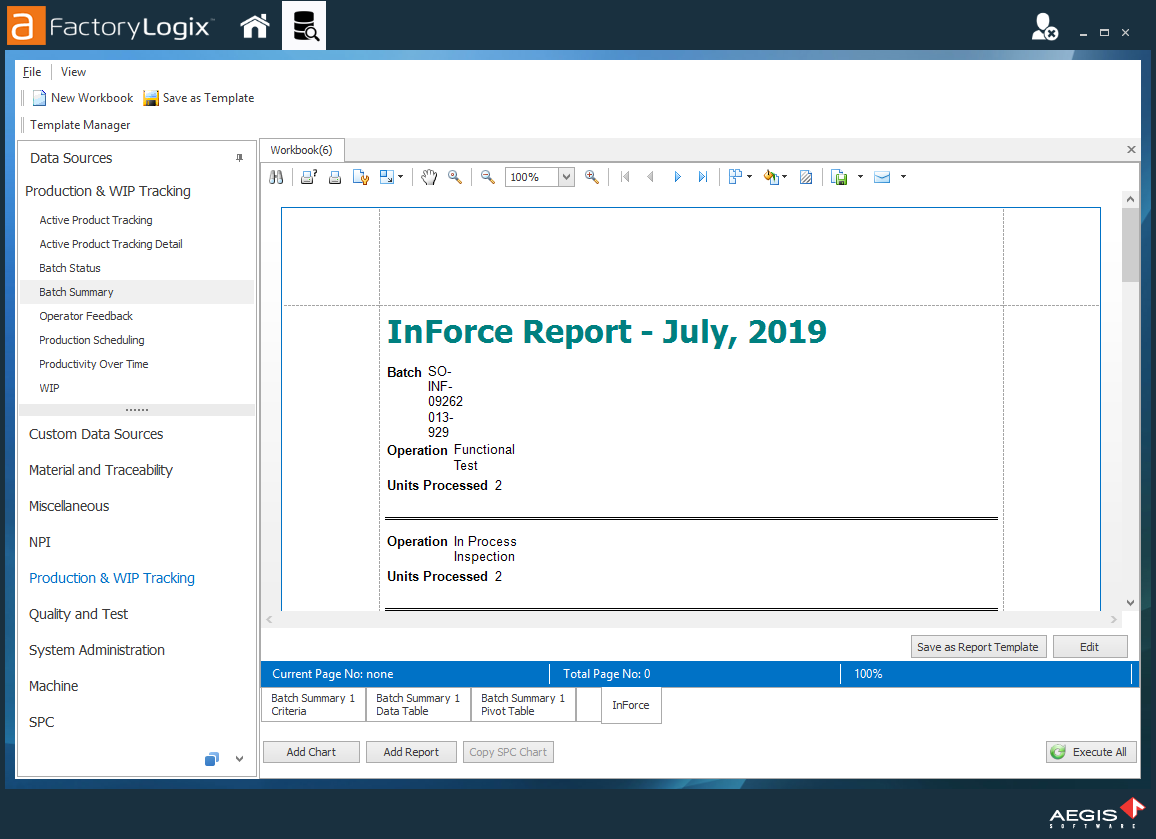
Select OK in the lower-right corner of the window to add the report to the associated DataMiner workbook.
You now have an additional tab at the bottom of the DataMiner window in the workbook for your report. If this is the first report you added, it will be named Report 1 by default.Right-click the report tab, select Rename Worksheet, then enter a new name for the report tab.
To save this report as a template to reuse later, select the Save as Report Template button. The report formatting will be saved so you can use it again for future reports.
Enter a Name for the template.
Select the Grant Access tab.
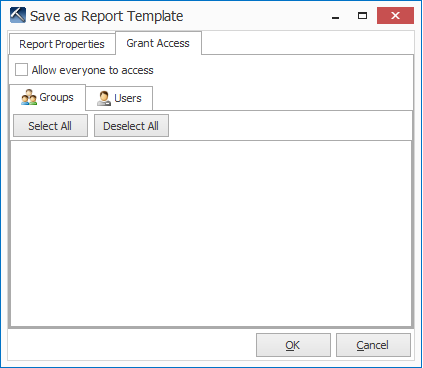
Select the users and groups you want to give access to or select the Allow everyone to access check box to give all FactoryLogix users access to this report template
Select OK to save the basic report template with the access options you selected.
Now select the Save As Template
 button at the top of the DataMiner window.
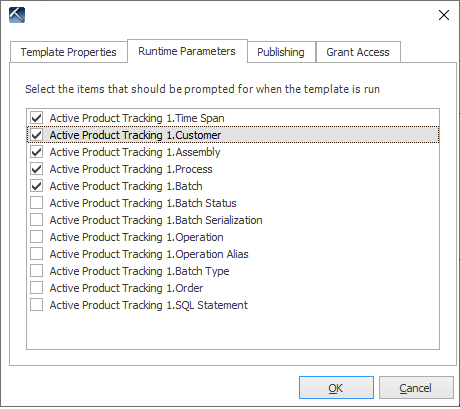
Select the Runtime Parameters tab, then use the check boxes to select the desired runtime parameters for this report template. (Runtime parameters will be highlighted in Yellow for users to select when they run the report template.)
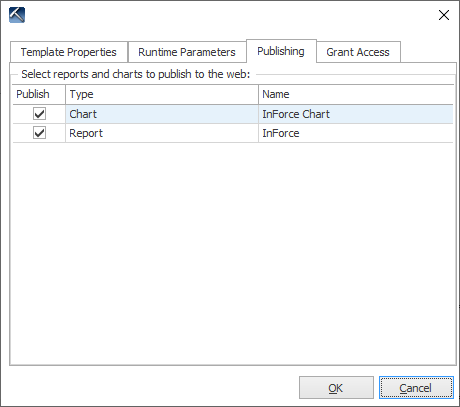
Select the Publishing tab.
Select the report (and chart if you choose to include one) you want to publish to the web and make available to others in the template.
Select OK to complete the report template. When prompted, select Yes to overwrite the existing template and confirm your selections.
Related topics |
|---|