Run a data set
This topic takes you through the typical steps in DataMiner to select data sources for a batch, arrange data columns, run the data set, then save the data in an Excel file.
Important
At the end of this topic, keep your data set open, so you can Save a data set as a template for future reuse.
Log into the Analytics client application.
Select the Data Miner/Data Analysis button.
Tip
Creating and saving workbook templates can save you valuable time if you need to generate the same or similar reports multiple times. When you open Data Miner, your templates are shown at the top of the window. To view and manage your templates, select Template Manager in the upper-left corner of the window.
Under Data Sources, select Production and WIP Tracking.
Right-click the Active Product Tracking data source, then select Add New Workbook.
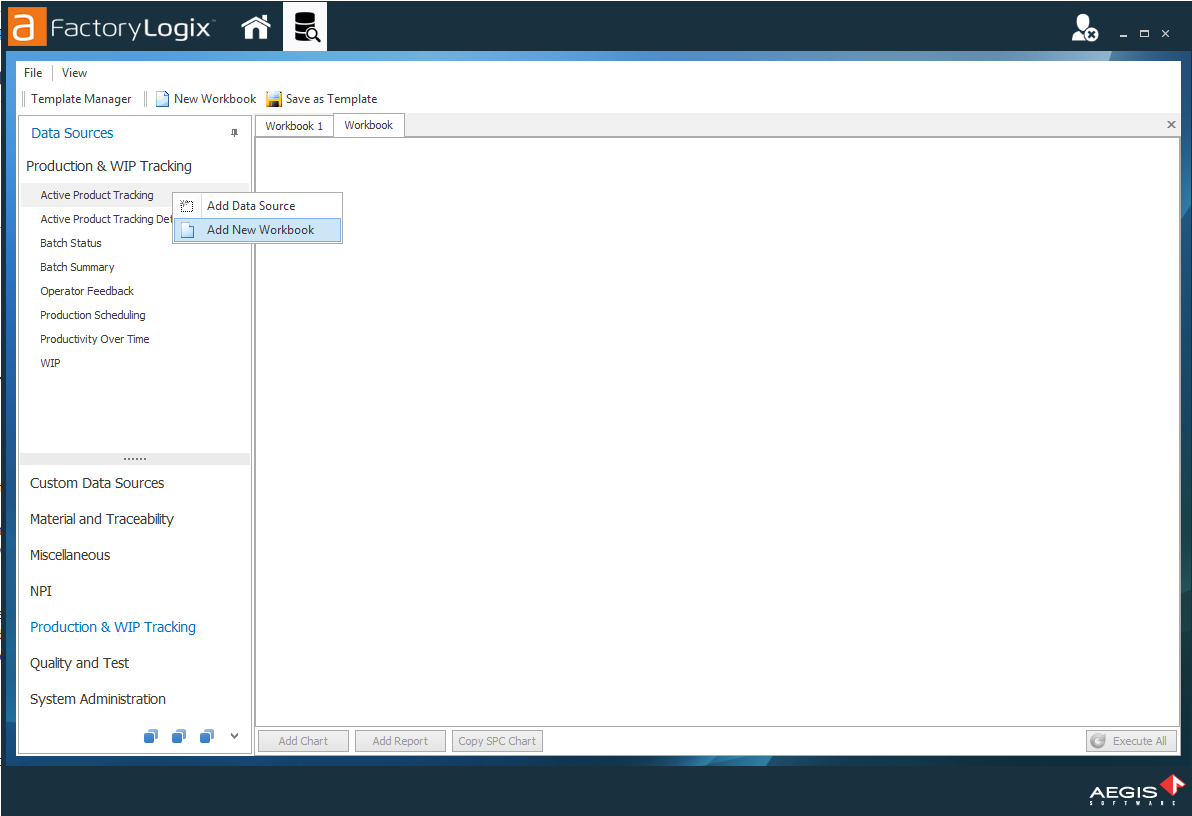
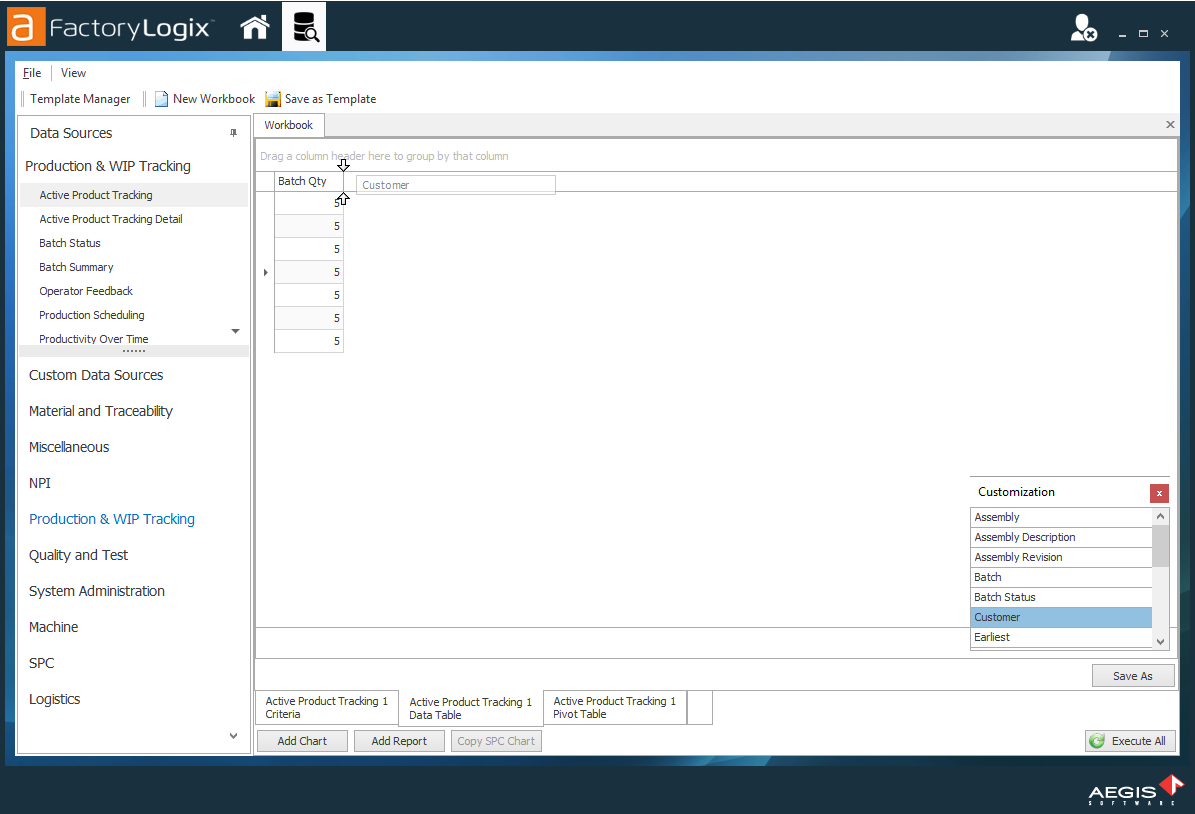
A new workbook and the Active Product Tracking search criteria are added to the work area.
Select the Batch button, then enter the first few characters of the batch name to search for the batch.
Batch names matching your search criteria are displayed.
Tip
Enter an asterisk * character to return all data quickly in a data Look Up dialog.
Select a batch, then select OK.
Note
You can also type directly in the search area next to the Batch button, then press Ctrl+K to find a single item that matches what you enter. If multiple items match what you enter, the Look Up dialog displays so you can make a selection.
The batch you selected is listed in the search criteria of the data source. In this case, the single batch you selected is shown.
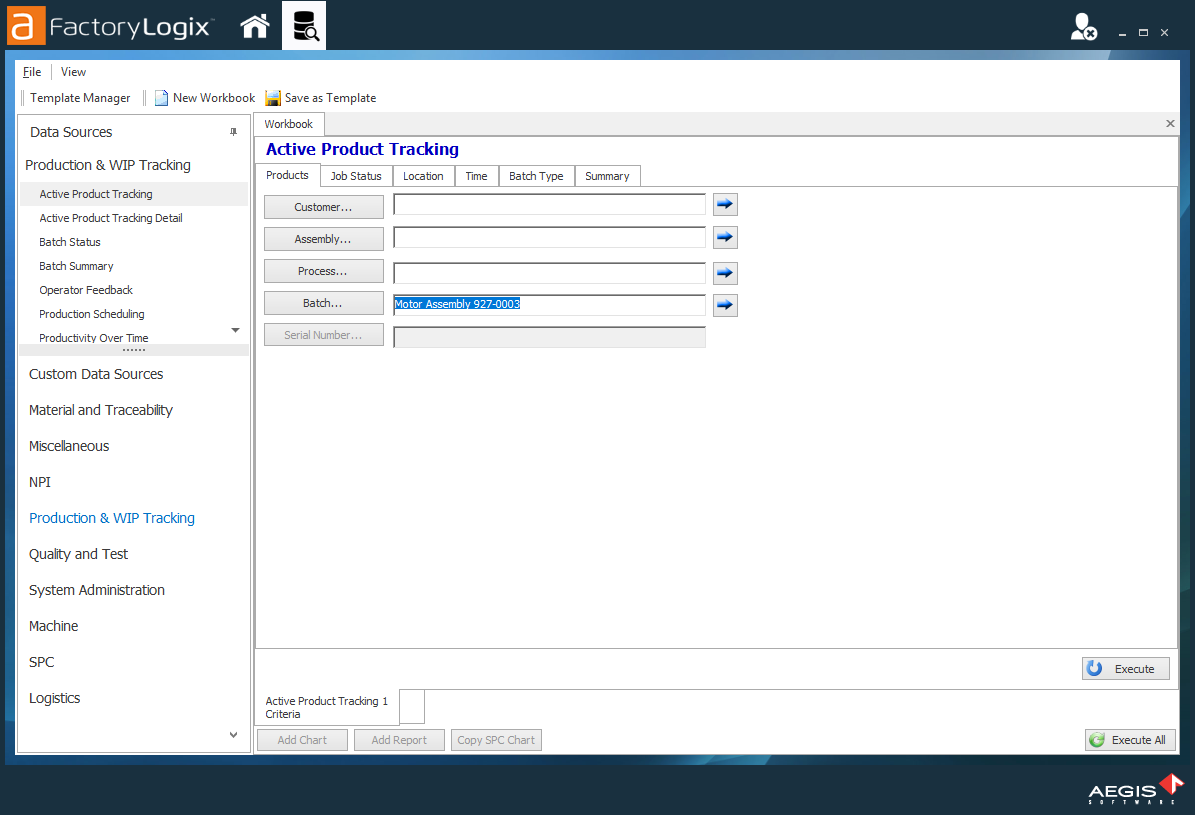
Search criteria for a data source are not limited to a single item (in this case, a single batch). You can select multiple batches and other search criteria by clicking the tabs (Job Status, Location, Time, and Batch Status). The data returned for the search will include all active WIP for the selected batch. Use the Summary tab to view a summary of your search results that will be used to run the data set.
(Optional) Select the Propagate Value button (the Blue arrow)
 to propagate a value of a search field in one data source to another—or to all data sources—within a single workbook (if they have the same data sources available to the data set).
Select the Execute button in the lower-right corner of the window to initiate the search and return the active WIP data. (The type of data returned for the source is predefined and will vary by source.)
Note
The Execute button executes a data search one data source at a time. If a single workbook contains a single data source, then the data for that source will be returned. If a workbook contains multiple data sources, the execute button returns the data for the selected data source (by its tab).
The Execute All button executes a search on all data sources in a single workbook simultaneously. If there are multiple workbooks in the work area, only the selected workbook will return data.
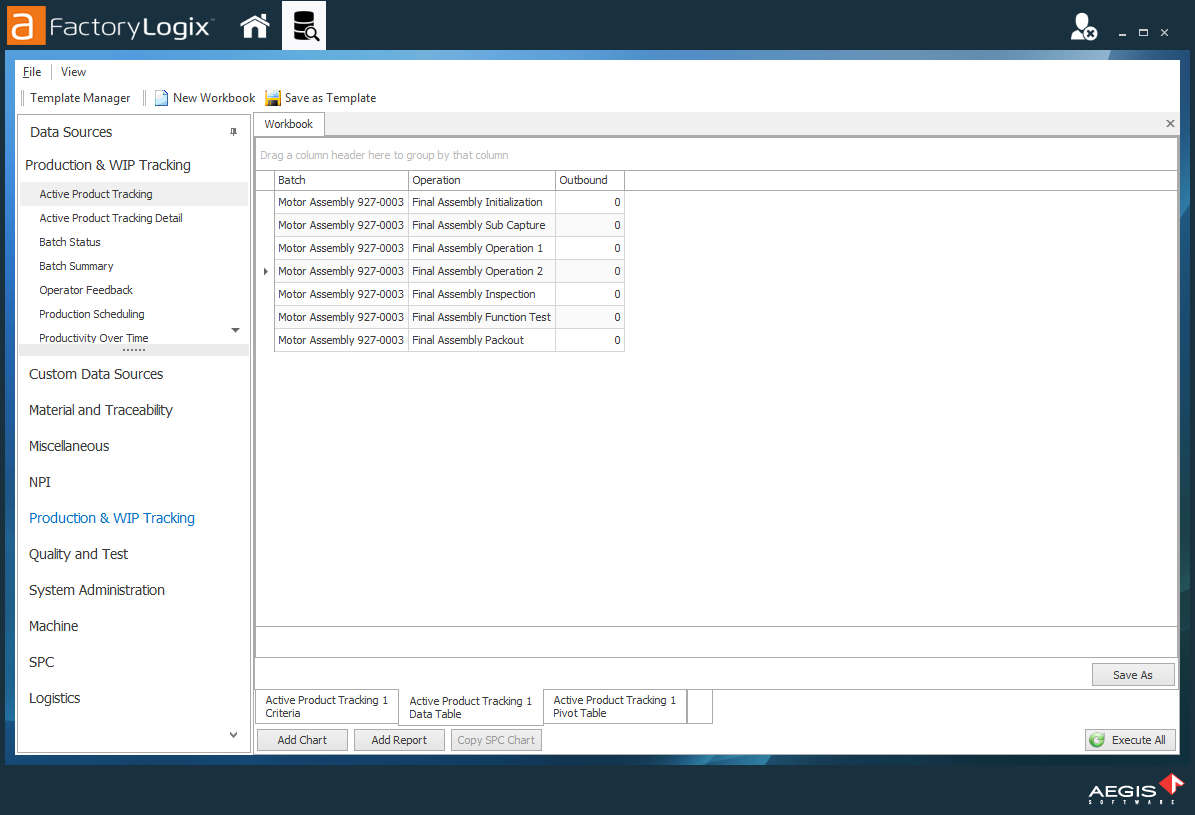
Now you can see the data table returned and a Data Table tab at the bottom of the window.
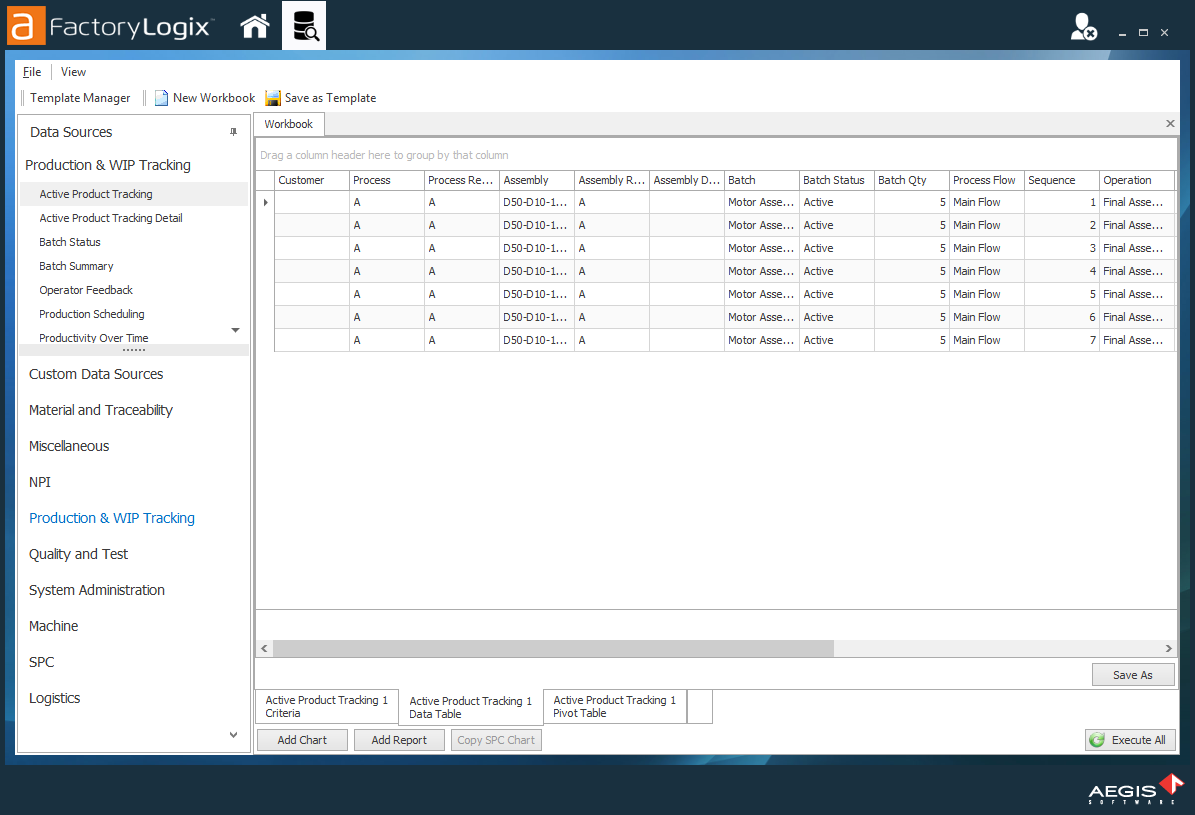
Right-click a column header, then select Best Fit (all columns) from the menu to resize the columns to their optimal widths for better viewing.
Right-click a column header and select Hide All Columns to hide all the columns and put them into the Column Chooser.
Tip
When you hide all columns, the data table is blank. You can drag columns one-by-one back into the data table—this is an easy way to help you put only the data you need into the table and is very useful when you have many blank or unnecessary columns.
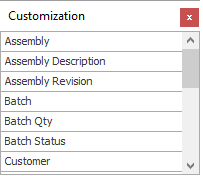
Drag a column name from the Column Chooser to the top of the work area (this is the fastest way to have only the columns you want to work with inside the data table).
For this example, drag Batch, Operation, then Outbound to the top of the data table to display those data columns. (As you drag a column name, two arrows indicate where to drop it in the data table.)
Note
You can also right-click a column and select Hide Column, but this method hides only one column at a time and is not as fast as dragging and dropping columns from the Column Chooser into the work area.
Select the Red Close
 box to close the Column Chooser. (You can redisplay the Column Chooser any time by right-clicking a column header and selecting Column Chooser.)
To group columns, you drag and drop column names onto the column header grouping section at the top of the work area. You can select a specific order as you group by column. You can also change the grouping order at any time by dragging and dropping a column name.Drag the Batch column name onto the column header grouping section, then drag and drop the Operation column name to the right of the Batch column. (Leave the Outbound column in the header bar for now.).
You can now see the grouping and how it affects the view in the data table.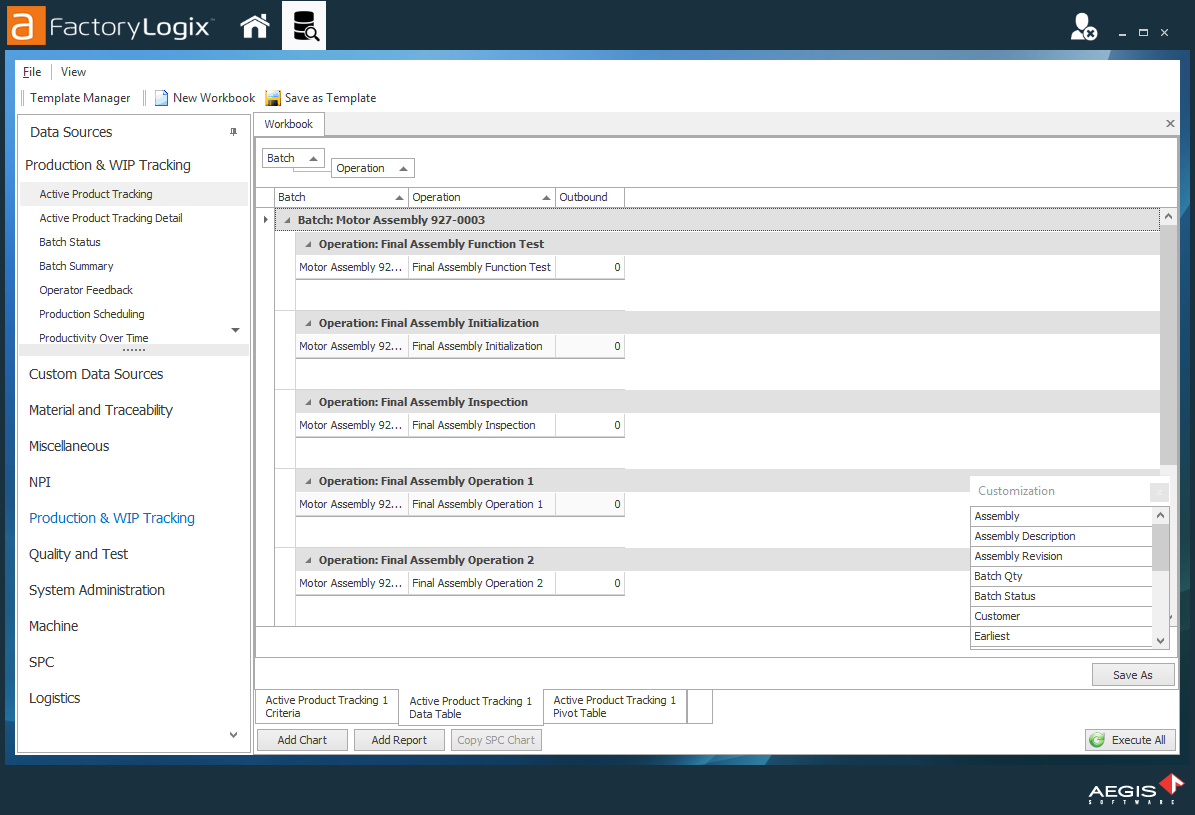
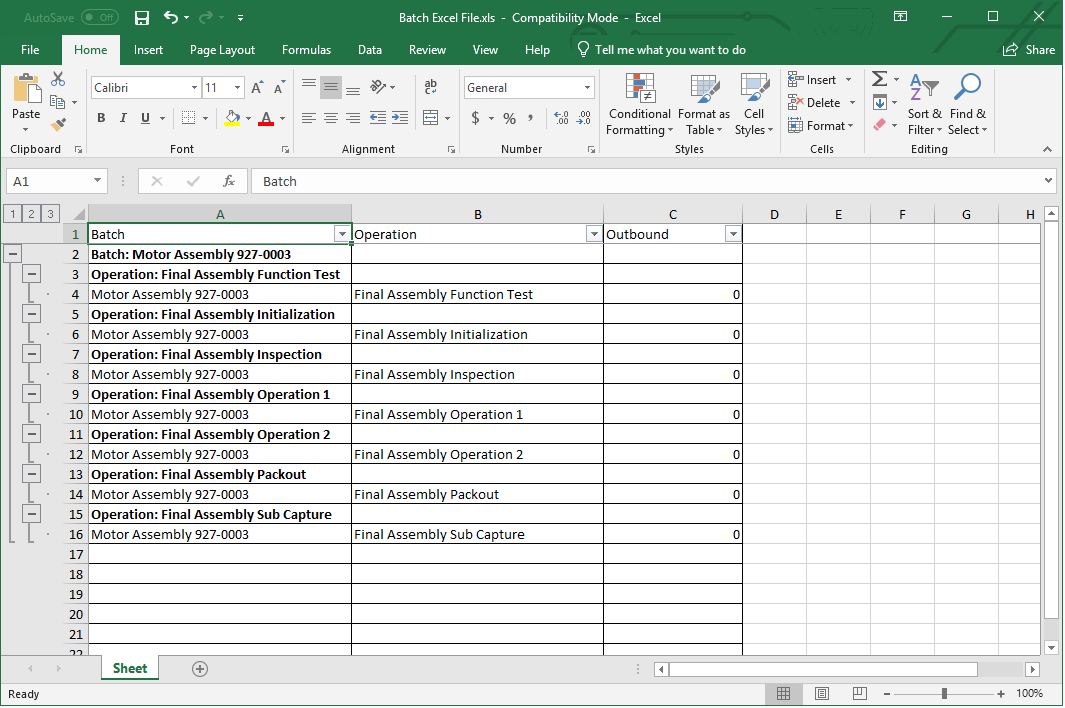
Select Save As in the lower right corner of the workbook window, select the xls (Microsoft Excel) format, enter a name and location for the file, then select Save.
Open the Excel file you just created to see a spreadsheet listing of outbound units by batch and operation.
Important
Due to resource requirements by Excel, we recommend you limit your data exports to no more than a few thousand rows.