Group, sort, filter, and format workbook data
You can group, sort, filter, and format DataMiner workbook data before creating a chart, pivot table, or report.
For simple data grouping, drag any column heading into the group-by box at the top of the columns.
In the following example, data is grouped by part Description.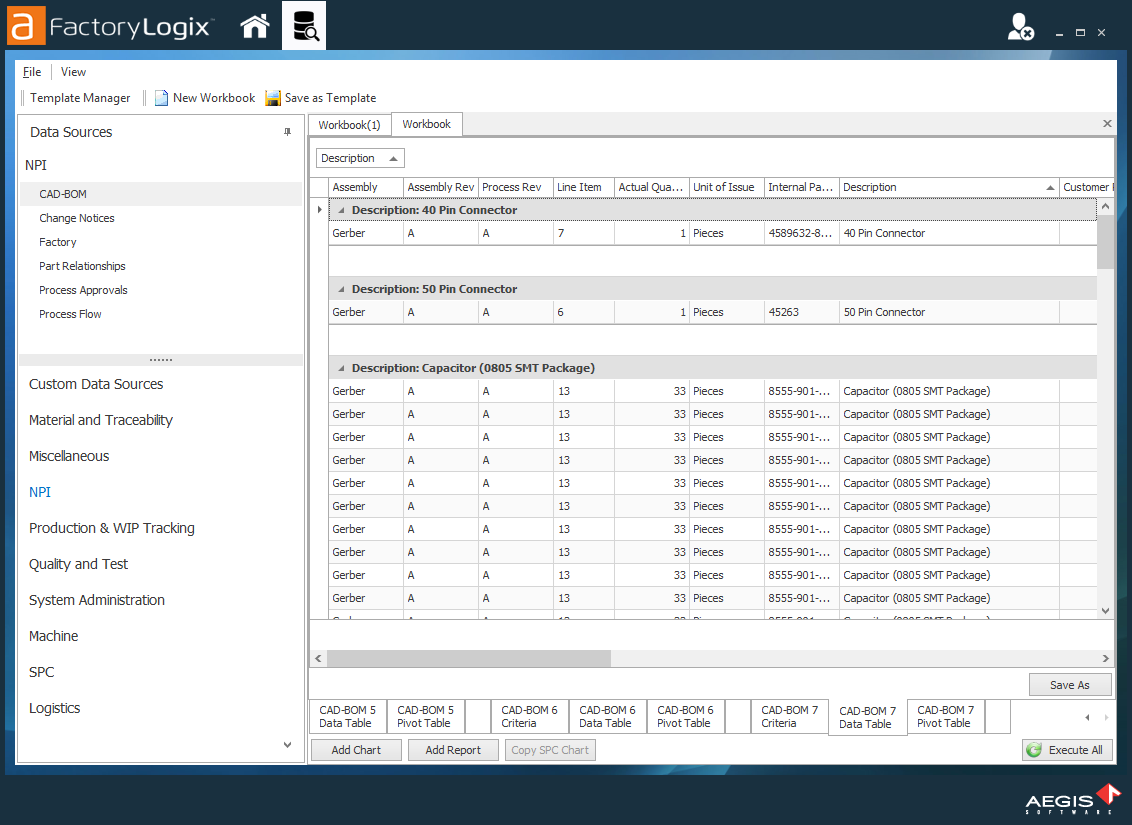
Use the column editing commands
While working with workbook data in DataMiner, right-click any column header to open the Column menu that has commands you can select to manipulate the data.

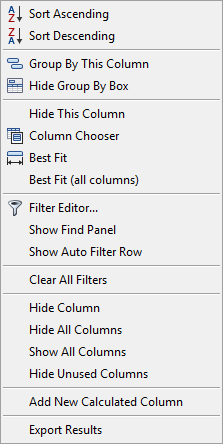
The following table describes the Column menu commands.
Column menu command | Description |
|---|---|
Sort Ascending | Sorts column data in ascending order (A-Z). |
Sort Descending | Sorts column data in descending order (Z-A). |
Clear Sorting | Removes all previously-applied sorting of column data. |
Group By This Column | Adds this column to the grouping. You can also drag a column to the header area to group the data. After columns are grouped, you can drag and drop them in any order. |
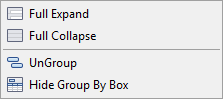
Show/Hide Group By Box | Shows or hides the column Group By box. |
Full Expand/Full Collapse | When you right-click a grouped column, expands/collapses data from that column to the beginning/end of the grouped data. |
Remove this Column | Removes a column from the table. |
Column Chooser | Opens the customization dialog where you can select only those columns you want to be visible. |
Best Fit | Resizes a column width to the widest entry in that column. |
Best Fit (all columns) | Resizes all column widths so that the widest entry in each column is visible. |
Filter Editor |
Note For detailed information about using the Filter Editor commands, see Filter column data with the Filter Editor. Allows you to filter a column using various statements and values:  |
Show Find Panel | Displays a search box where you can enter search keywords and terms. When you select the Find button, your search terms are highlighted in the data table (if found). |
Show Auto Filter Row | Adds a row under the column heading so you can filter a column on just the data you enter in the filter row. |
Clear All Filters | Removes all applied filtering from all columns. |
Hide Column | Removes the selected column from the data table view. |
Hide All Columns | Removes all columns from the data table view. |
Show All Columns | Restores the display of all previously-hidden columns in the data table view. |
Hide Unused Columns | Hides columns that are not being used in the data table. |
Add New Calculated Column | Creates a column that displays the results of a calculation you define in the Add New Calculated Column dialog. 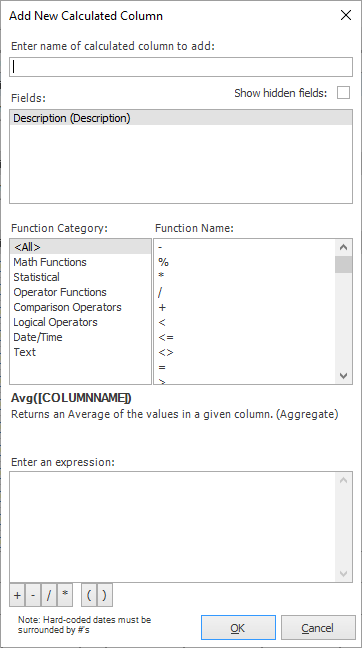 |
Export Results | Exports the results of a data table to Excel, XML, HTML or .txt format. |
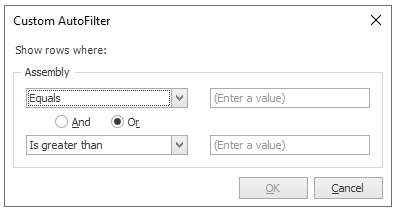
Use the Custom AutoFilter menu
When working with DataMiner workbook data (specifically data tables), custom column data filtering options are available that you can use to filter data in a more granular way.
To view the Custom AutoFilter commands, select a column header, select the small "pushpin" icon to the right of the column title, then select (Custom) from the menu that displays.

In the Custom AutoFilter dialog, specify the desired data filtering criteria, then select OK.
Filtered results are displayed at the bottom of the DataMiner window and will be used for your data table. Select the Edit Filter button to edit the custom filter at any time. To delete the custom filter, select the Close box on the left side of the window next to the custom filter description.
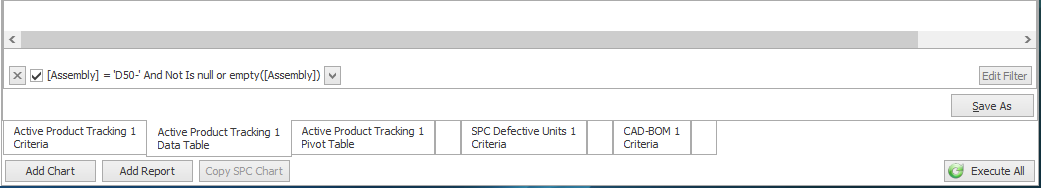
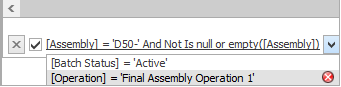
Note
You can also use the drop-down menu for the custom filter and delete filter criteria by selecting the Red Delete ![]() button to the right of the data source filtering item.
button to the right of the data source filtering item.
Use summary commands for grouped column data
After you group column data by one or more data fields, the data can be summarized at the footer of the column (the blank area just below the last cell in the grouped column).
To summarize column data, right-click the footer of a grouped column, then select a command.
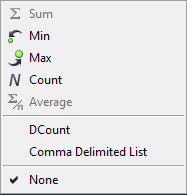
The summary commands are described in the following table.
Command | Description |
|---|---|
Sum | Adds all values to get the total sum. |
Min | Displays the minimum value contained in the column. |
Max | Displays the maximum value contained in the column. |
Count | Displays the count of values contained in the column. |
Average | Displays the average of all the values in the column. |
DCount | Calculates the number of distinct (unique) values in the column. |
Comma Delimited List | Lists the contents of the column in a comma separated list. |
Tip
The summary commands are helpful when creating charts. The size or length of a bar or indicator in a chart is determined by the column summary values.
Expand or collapse grouped column data
To expand or collapse grouped column data for easier reading, right-click above a column header and select Full Expand or Full Collapse.