Create a workbook
Workbooks
Before you can create a report, pivot table, or chart, you need to create a workbook for your data. You can create as many workbooks as you need in DataMiner to display data in different sets and configurations. For example, one workbook might contain quality data; another might feature data from a selected Bill of Materials (BOM).
The following illustration shows a typical workbook created in DataMiner.
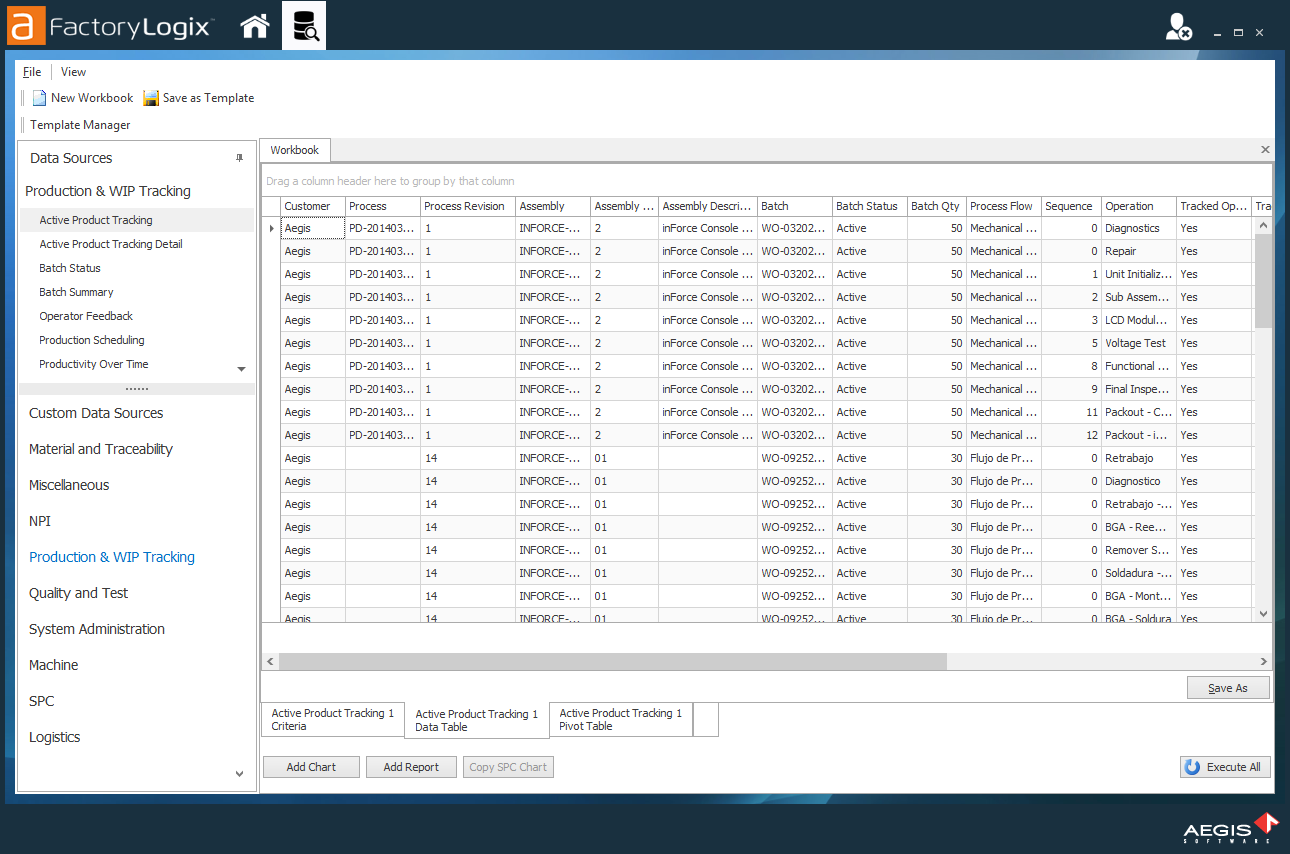
Data sources
Data sources return predefined data, depending on the specific source and the search and filtering options you specify. When data is returned from search and filtering, you can manipulate and format it into specific value sets for use in charts, reports, pivot tables, or for raw export to various data formats such as *.xls, *.xml, and *.txt. A workbook can have one or multiple data sources, so there are many possible combinations of data for analysis and reporting.
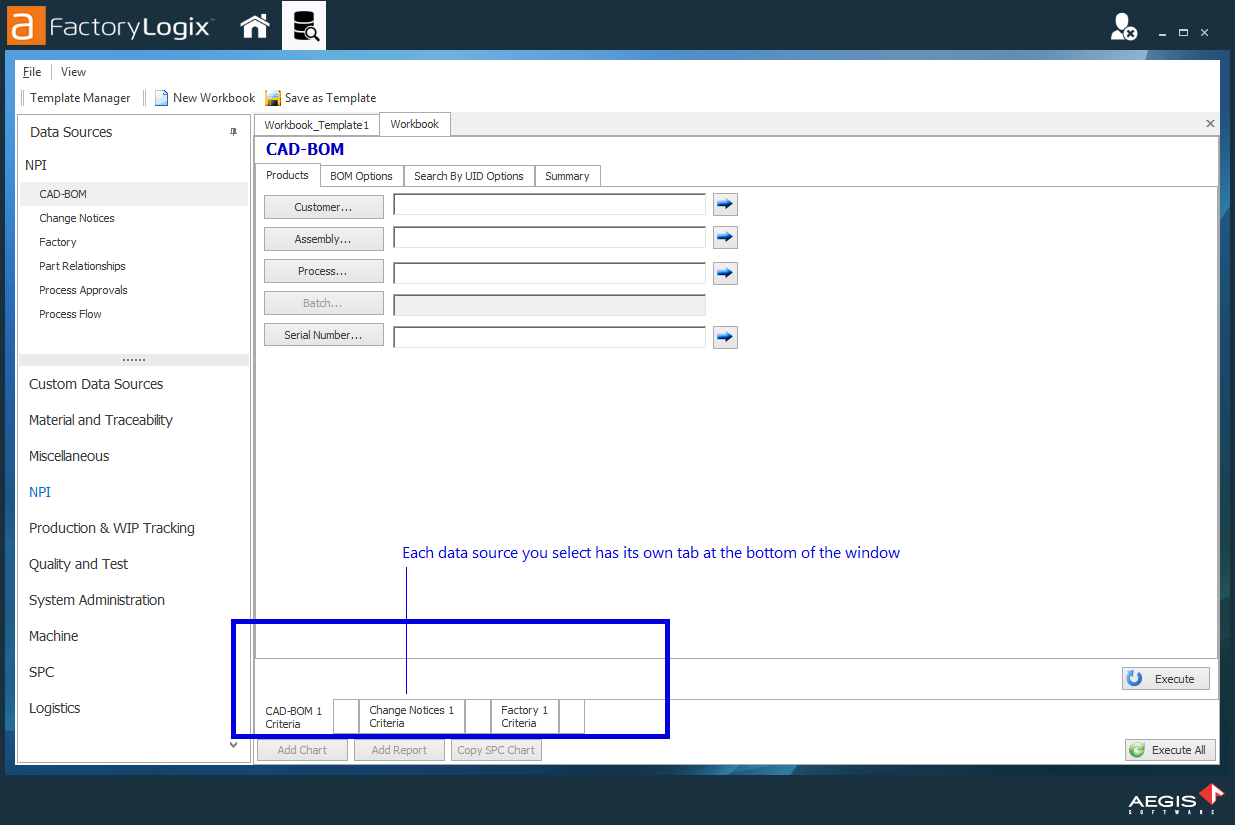
Each data source has its own tab at the bottom of the workbook view; tabs at the top of the window contain the specific search and filter criteria for the selected data source.
Tip
You can create a workbook three ways:
Select New Workbook from the menu bar.
Right-click a data source and select Add New Workbook to create a new workbook with that active data source.
Double-click a data source to create a new workbook with that active data source.
The default name for a new workbook is Workbook (1), Workbook (2), and so on. We recommend you implement an effective workbook naming convention to display your data accurately to others and to help keep your workbooks organized.
Log into the Analytics client application.
Select Data Miner/Data Analysis from the Analytics Home window.
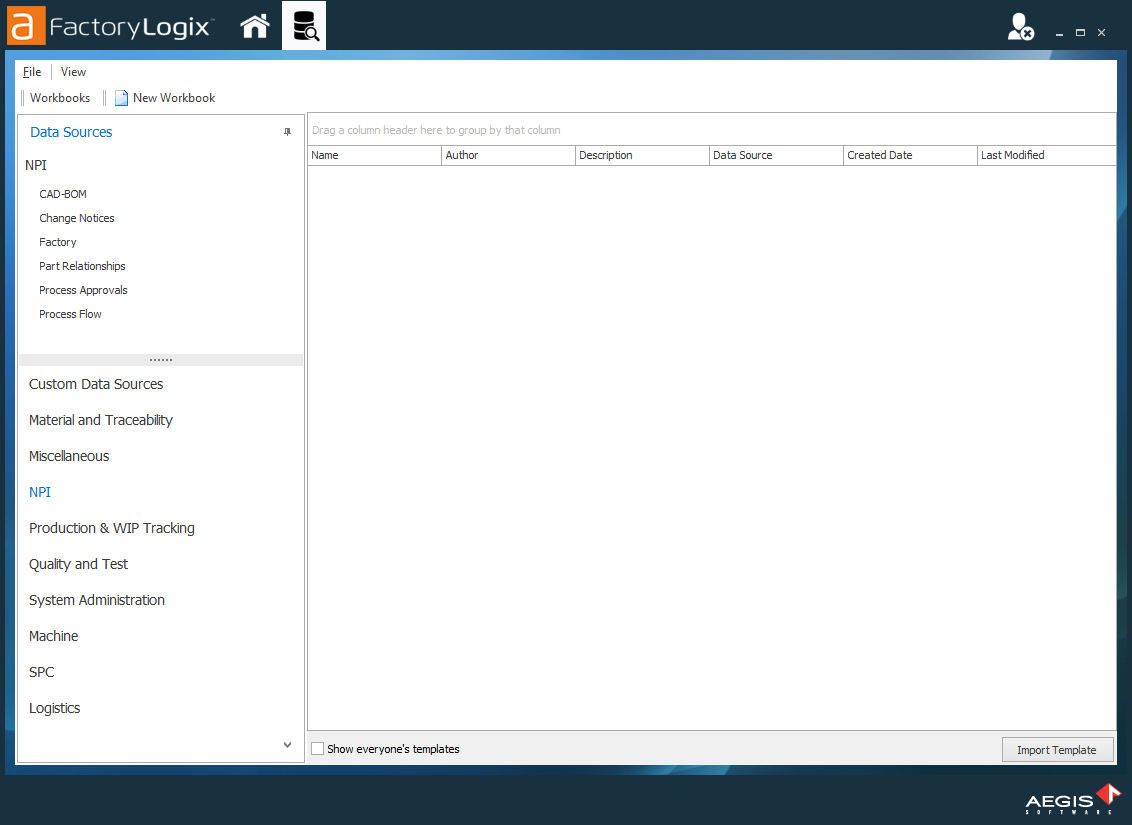
Select New Workbook at the top of the DataMiner window.
Under Data Sources, select a data source category for your report, pivot table, or chart (Material and Traceability, Miscellaneous, NPI, Production & WIP Tracking, and so on).
Note
For details about the individual data sources you can select, see Get started with DataMiner.
In the following example, we selected the NPI data source category to display NPI data sources for the workbook (CAD-BOM, Change Notices, Factory, and so on).
Now you're ready to search and filter the data so you can customize the data for your charts and reports.
Run a data set
After you add a data source, the Execute and Execute All buttons become available. These buttons initiate the data search/return after you define the search and filtering criteria.
The Execute button executes a data search one data source at a time.
If a single workbook contains a single data source, then the data for that source will be returned. If a workbook contains multiple data sources, the execute button returns the data for the selected data source (by its tab).The Execute All button executes a search on all data sources in a single workbook simultaneously.
If there are multiple workbooks in the work area, only the selected workbook will return data.