Skip table of contents

Search and filter options for data sources

Depending on the selected data source, you can search and filter by multiple fields/criteria in the FactoryLogix database.

  1. Log into the Analytics client application.

  2. Select Data Miner/Data Analysis to start DataMiner.

  3. Create a workbook or open an existing workbook.

  4. On the left side of the window under Data Sources, select a category to display the data sources for the category.

  5. Double-click a data source to view its associated tabs and options.

Important

The available search and filter options depend on the data source you select. For example, on the Products tab, you only see the GRN option for the GRN Status and Material Purchase Orders data sources. If an option isn't available for the selected data source, it will be dimmed.

Some search and filtering options may be dimmed (unavailable depending on the selected category and data source

Propagate Value button

The Propagate Value button (the Blue arrow) image-20240823-151249.png propagates the value of a search field from one data source to another data source—or to all data sources—within a single workbook (if they have the same data sources available to the data set).

Look Up dialog

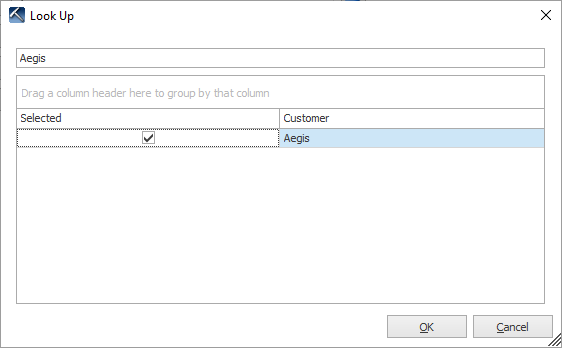
When you select some search/filter options (Customers, for example), a Look Up dialog displays. When you start typing, the dialog displays data matching the criteria you type.

Tip

Enter an asterisk * character to return all data quickly in a Look Up dialog.

Look Up dialog

Here is an example of the search and filter tabs for the NPI/CAD-BOM data source. (The individual tabs and options change depending on the data source category and individual data source you select.)

data source search and filter options example

Search and filter options (by tab name)

The following table (organized alphabetically, by tab name) describes the DataMiner search and filtering tabs and the options available on each tab.

Note

Not all tabs and filtering options are available for all data sources; the options displayed are specific to the data source you select.

Tab

Search and filtering options

Barcode Template (System Administration category)

  • Template Name

More information: Create a barcode template

Batch Type (Miscellaneous category)

  • Use Filter by Batch Type

    • Select a Batch Type 

      • Production

      • Receiving

BOM Options

  • Consolidate Reference

  • Add AML\AVL\Alternate IPN Info

  • Add CTO Option Codes

More information: Part LibraryConfigurable assemblies

Change Notice Type

  • Change Notice Type:

    • Any

    • Batch

    • Assembly

    • Process

    • Barcode

    • Part Number

    • Operation

    • Operation Alias

    • Workstation

More information: Approvals and sign-off

Data Source Join Properties

  • Select related columns to join data sources

  • Select the type of data join to create

    • Include all rows where the joined columns match both data sources

    • Include all rows from data source A and only the rows from data source B where the join columns match

    • Include all rows from data source B and only the rows from data source A where the join columns match

Group By

  • View Faults Collected By:

    • Feeder

    • Part

    • Nozzle

    • Reference Designator

  • View PPM Summary Data Collected By:

    • Feeder

    • Nozzle

    • Part

  • Time (Enable)

    • Year

    • Quarter

    • Month

    • Week

    • Day

    • Hour

  • Location

    • Operation

  • Product (Enable)

    • Customer

    • Assembly

    • Process Revision

    • Batch

  • Placement Type

    • Feeder

    • Feeder and Feeder Slot

Job Status

  • Batch Status

    • Any

    • Closed

    • On Hold

    • Open

  • Serialization

    • Any

    • Non-Serialized

    • Serialized

    • Hybrid

More information: Entry/exit conditions and actions for product tracking

Location

  • Operation Group

  • Operation Alias

  • Operation

  • Workstation

  • Resource Type

More information: Process flow operations

Logistics

  • Transport Order

  • Part Number

  • UID

  • Kit Group

  • Stock Location

  • Stock

More information: Printed label templates for materials and transport ordersUsing Logistics

Materials

  • Item Types

  • Lot Number

  • Inventory UID

  • Trace Barcode

More information: View archived records in the Trace window

Non-Conformances

  • Title

  • Number

    • Non-Conformance Status

      • Disposition

      • Correction

      • Root Cause

      • Action

      • Complete

      • Closed

      • Cancelled

  • Action Plan Name

    • Action Plan Type

      • Correction

      • Containment

      • Corrective

      • Preventive

      • Root Cause Analysis

More information: What is a non-conformance?

OEE Quality Metrics

  • Workstation

More information: Configure OEE

Operator Feedback Status (Production and WIP Tracking category)

  • Use Filter by Operator Feedback Status

    • Select an Operator Feedback Status 

      • New

      • Under Review

      • Reviewed

      • Closed

      • Ignore

Options

  • Include Sub-Assemblies

  • Show Only Trace Barcodes

  • Use Only Completed Units

  • Group Operations by Area

  • Report Inbound Product Barcodes

  • Line

  • Show Operation Data

  • Show Completed Only

  • Shift

  • Include Dwell Time to Next Station

  • Include User Touch Time Data

  • Include Activity Detail Data

  • Current Defect Status (Open, Closed, Fixed, False, Deleted)

  • Measurements

    • Histogram Options

      • Bin Count

      • Using a Sample Population

    • User-Defined Specification Limits

      • Upper Specification Limit

      • Lower Specification Limit

      • Nominal Value

Options (Inventory, Material and Traceability category)

  • Item Class

    • Include Parts

    • Include Tooling

    • Include Consumables

    • Include Carriers

  • Statuses

    • Include Active

    • Include On Hold

    • Include Depleted

    • Include In Stock

    • Include All

  • Fields

    • Show General Fields

    • Show Logistics Fields

    • Show Electronics Fields

    • Show Custom Fields

  • MSD Material

    • Show Only MSD Material

    • Show Closed Material

    • Show Open Material

Options (Archive and Restore History, Miscellaneous category)

  • Serial Number

  • Archived Material

  • Types

    • Archived

    • Restored

  • Item Types

    • Assembly Revision

    • Production Process

    • Receiving Process

    • Batch/GRN

    • Product UID

    • Materials

    • Machine Performance Data

  • Other

    • Show Latest Only

  • Symptom

    • Include Defect Detail

    • Include Measurement Detail

More information: ArchivingRestore archived data

Options (DPMO (IPC-7912)), Quality and test category

  • Use Only Completed Units

More information: DPMO and opportunity count methodologies

Options (Production Scheduling, Production and WIP Tracking category)

  • Line

  • Show Operation Data

  • Show Completed Only

More information: Production planning and scheduling

Options (Productivity Over Time, Production and WIP Tracking category)

  • Shift

Options (Quality, Quality and Test category)

  • Symptom

  • Current Defect Status

    • Open

    • Closed

    • Fixed

    • False

    • Deleted

More information: Defect collection in the Hot Spot Viewer

Options (SPC Measurements, SPC Category)

  • Measurements

  • Histogram Options

    • Bin Count

    • Using a Sample Population

  • User-Defined Specification Limits

    • Upper Specification Limit

    • Lower Specification Limit

    • Nominal Value

More information: Use dashboard gadgets

Options (WIP, Production and WIP Tracking category)

  • Include Sub-Assemblies

  • Include Dwell Time to Next Station

  • Include User Touch Time Data

  • Include Activity Detail Data

Here are some definitions to help you understand how WIP calculations are done in DataMiner:

  • Cycle time - The complete time a unit has been at an operation. It begins when the unit is first scanned into an operation and stops when the unit is finished. Pausing the unit does not stop the cycle time count.

    The calculation is: TimeComplete - TimeStarted = Cycle Time.

    This data is in the WIP data source.

  • Touch time - The total time that a unit is started at an operation and not in a paused state.

    This data is in the WIP data source and you must select the option to Include User Touch Time Data to calculate touch time.

  • Dwell time - The time from when a unit is finished at Operation A until it is started at Operation B. This time is calculated from the finish time of Operation A to the start time of Operation B. This is in the WIP data source and you must select the option to Include Dwell Time to Next Station to calculate dwell time.

More information: Entry/exit conditions and actions for product tracking

Orders (Material Purchase Orders, Logistics category)

  • Order

  • Order Status

    • Any

    • Closed

    • On Hold

    • Open

More information: Material Purchase Orders (POs)

Part Relationship

  • Part Attributes

    • Part Number  (Polarized, Non-Polarized, Either)

  • Customer Part Relationship

    • Customer

    • Part Number

  • Vendor Part Relationship

    • Vendor

    • Part Number

  • Manufacturer Part Relationship

    • Manufacturer

    • Part Number

More information: Link part numbers to create relationships

Products

  • Customer

  • Assembly

  • Process

  • Batch

  • GRN

  • Serial Number

More information: Libraries

Receiving Options 

  • Part Number

  • Vendor

More information: Vendors and logistics

Resources

  • Factory

  • Area

  • Line

  • Cluster

  • Workstation

  • Resource Type

More information: Create a factory and set up factory resources

Search by UID Options

  • Include SubAssemblies

More information: Using LogisticsUID Format

Sites

The factories/sites you query for enterprise data.

More information: Using the Enterprise Warehouse

SQL (User Defined)

  • Enter SQL Statement

Note

When entering SQL statements, you can get help by right-clicking anywhere in the SQL area to display a menu of SQL commands.
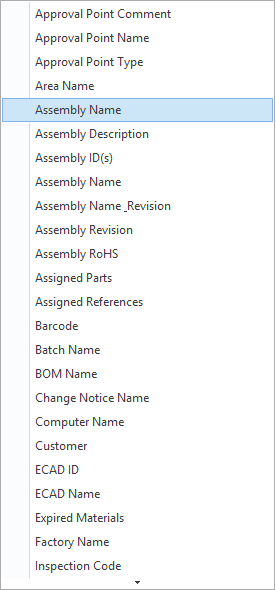
SQL command menu

Sub Group

  • Product (Enable)

    • Customer

    • Assembly

    • Assembly Revision

    • Process Revision

    • Batch

    • Units

    • Sample Size

  • Time (Enable)

    • Year

    • Quarter

    • Month

    • Week

    • Day

    • Hour

Summary

The Summary tab shows a summary of all search and filtering selections from the other tabs for the selected data source.
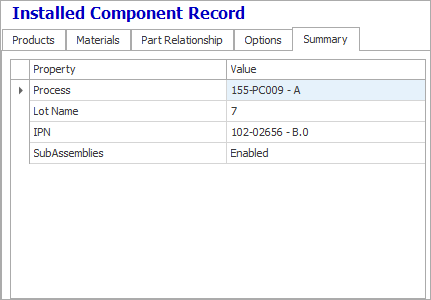
Summary tab

Time

Date Time Range:

  • FIFO Time

  • Expiration Date

  • Manufactured Date

  • MSD Open Time

  • MSD Expired Time

  • Stocked Date

  • Stocked Out Date

  • Modified Date


  • Created Date

  • Started Date

  • Finished Date


  • Scheduled Start

  • Scheduled End

  • Time Started

  • Time Finished


Note

Under Date Time Range, the first drop-down is sometimes dimmed, but it does provide a reference to help you understand what the Time drop-down indicates. For example, when you select the Time tab for the Tool Usage History data source (Material and Traceability category), the drop-down indicates Calibration Expiration Date as a reference to help you select the appropriate time from the second drop-down.

Time drop-down:

  • Any Time

  • Custom Range

  • Yesterday

  • Today

  • Last Week

  • This Week

  • Last Month

  • This Month

  • Last Year

  • This Year

  • Last 4 Hours

  • Last 8 Hours

  • Last 12 Hours

  • Last X Many Years

  • Last X Many Months

  • Last X Many Weeks

  • Last X Many Days

  • Last X Many Hours

  • Last X Many Minutes

  • Tomorrow

  • Next Week

  • Next Month

  • Next Year

  • Next 4 Hours

  • Next 8 Hours

  • Next 12 Hours

  • Next X Many Years

  • Next X Many Months

  • Next X Many Weeks

  • Next X Many Days

  • Next X Many Hours

  • Next X Many Minutes

  • This Hour

User Details (User Detail, System Administration category)

  • User

  • User Role

  • User Group

  • Certification

More information: Create and manage users and groupsAbout user roles

Note

To access advanced filtering options and data manipulation techniques for your FactoryLogix data, see Group, sort, filter, and format workbook data

JavaScript errors detected

Please note, these errors can depend on your browser setup.

If this problem persists, please contact our support.